| Global Issues >> Energy >> A Model for the Quality of Life
Energy Vol. 16, No.4, pp.739-745,
1991 0360-5442/91
$3.00 + 0.00
|

|
Abstract— We present a mathematical model for the physical quality of life as a function of per capita electrical energy consumption. This model is based on data for 112 countries. Our equation may be used to assess the physical quality of life as a guideline for national planning.
INTRODUCTION
Only about one-quarter of more than 4 billion people on
this planet live in countries where the average food consumption
is well above physiological needs, where infant mortality
is relatively low (typically below 25 per 1000 live births),
life expectancy is high (around 70 years), and literacy
approaches 100%. These are the world's most developed nations:
one-quarter of mankind consuming four-fifths of the commercial
energy consumed annually and enjoying a quality of life
unsurpassed in history.
For the remaining three-quarters of the human population, conditions are painfully different. The overwhelming majority of these people are illiterate or semi-literate poor villagers surviving on less than adequate diets, whose infant mortality is an order of magnitude higher than in the developed world and whose life expectancy is as much as three decades shorter. The difficult present and less than promising future of this developing world, or as some prefer, the less developed countries (LDC) or underdeveloped Third World is, to a very large extent, the result of relatively low consumption of commercial energy.1
In developing countries, agriculture is the main source of biomass fuel, as well as one or the main energy-consuming sectors. The energy captured through agriculture in crops and crop residues provides food for people and fodder for draft animals, Dung and crop residues are used for cooking and heating.2,3 During the past two decades, these traditional energy sources have been supplemented by the use of coal, oil and electricity in agriculture, transport, industry, and the domestic sectors. The most striking feature of energy use in the Third World is that the amount of useful work which the poor obtain from the energy they use is relatively small.4 When the inputs to agriculture (including directly applied energy) are increased properly, the energy outputs per worker and per unit of land increase. Energy obtained from the consumption and sale of crops is, in turn, needed to increase the input to agriculture to raise crop yields, extend irrigated land, increase multicropping, mechanize construction and repairs of water projects, build modern roads, and, in general, improve the quality of life of the peasants. The rate with which the developing countries move toward the distant goal of rural modernization is largely determined by the direct and indirect energy flows into agriculture, which may be expected to make up a larger fraction of energy consumption in the future than at present.
The standard of living or quality of life achieved in any community and for any group of people may be measured, for practical purposes, by the quantity of total energy used per capita.5 It has been widely recognized that the preceding statement is more appropriate for societies in which the production and distribution of energy is secure and widely spread than for LDCs.
Several studies have been reported on increasing energy requirements for economic development and enhancing the quality of life, Smil6 reports that economic growth and energy consumption are closely related. Smil and Knowland7 state that energy is the prime mover for economic growth and development. Revelle8 comments that men and women in rural areas are tied to poverty and misery because they use too little energy and use it inefficiently. In addition, Rahman and Huq9 claimed that there was a distinct correlation between energy consumption and the overall economic conditions in any country. Brisco and Bari10 pointed out that the socio-economic position of rural people will deteriorate rapidly unless increased inputs of technology and energy are made into agriculture. Friedlander11 noted that in order to achieve an Improved standard of living, developed countries have encouraged the consumption of energy at a very fast rate Dalal5 emphasized that electrical energy consumption is an indicator of economic condition. Hoque et al12 state that the total energy produced and obtained from all possible sources is an index of the physical quality of life.
Forrester13 estimated the physical quality of life by using pollution, population density, food consumption, and resources as indicators. Islam14 quantified the quality of life by using 28 variables. Alam et al15 reported that the physical quality of life in developing countries depends on fundamental needs and energy consumption in various forms and quantified it in terms of cooking energy (in the form of bio-gas) and population density. Martin1 calculated the physical quality of life index for different countries by using an average life expectancy (LE) at age 1 year, infant mortality (IM), and literacy rates (LR).
In this paper, we present an empirical equation showing the relation between the physical quality of life and the per capita electrical energy consumption in kilowatt hours.
DEVELOPMENT OF THE MODELMartin1 defined the physical quality of life in terms of LE, IM, and LR and estimated the physical quality of life for 147 countries. However, we postulate that Martin's suggested approach of basing it on a variety of statistical social-condition indices related to population for the parts of the world under investigation leads to some vague data. Instead, we postulate that the electricity consumption figure per capita will implicitly include and also reflect the overall physical condition of people carrying on their various activities and passing their lives at a certain stage of development. We have obtained the per capita electrical energy consumption (kWh/cap) for 112 countnes.16
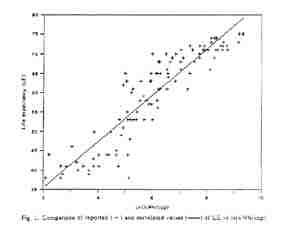
Fig. 1. Comparison of reported ( + ) and correlated values ( — ) of LE vs ln(kWh/cap).
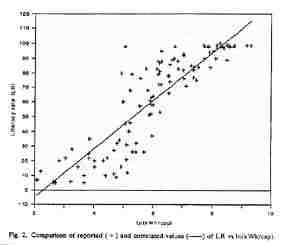
Fig. 2. Comparison of reported ( + ) and correlated values ( — ) of LR vs ln(kWh/cap).
In Fig. 1, we show the correlation (line) together with actual data for LE as a function of per capita energy consumption and the regression equation is:
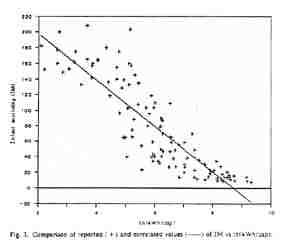
Fig. 3. Comparison of reported ( + ) and correlated values ( — ) of IM vs ln(kWh/cap).
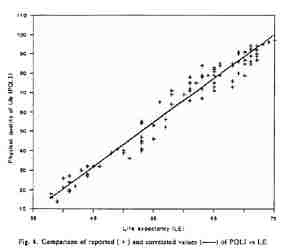
Fig. 4. Comparison of reported ( + ) and correlated values ( — ) of PQLI vs LE.
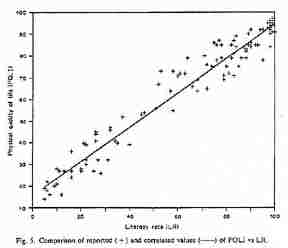
Fig. 5. Comparison of reported ( + ) and correlated values ( — ) of PQLI vs LR.
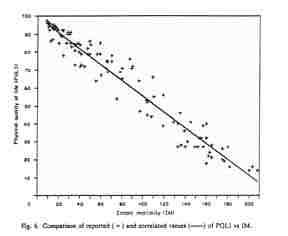
Fig. 6. Comparison of reported ( + ) and correlated values ( — ) of PQLI vs IM.
In Figs. 2 and 3, we also show the correlation (line) together with actual data for each or the variables LR and IM as a function of per capita energy consumption respectively and the corresponding regression equations are:
IM = 256.05 - 29.41(ln(kWblcap)) r = -0.88 (3)
Again, we show the correlation (line) together with actual data for physical quality of life as a function of each of the variables LE, LR and IM in Figs. 4, 5 and 6 respectively and the corresponding regression equations are:
PQLI = 15.65 + 0.79(LR), r = 0.98 (5)
PQLI -99.32- 0.44(IM), r = -0.97. (6)
Martin's estimation and examination of Figs. 1 6 and of Eqs. (1) (6) suggests the following functional relations:
kWh/cap = f2(LE, IM, LR), (8)
where PQLI = physical quality of life. Equations (7) and (8) suggest the relation
where A may be taken as a technological constant. This technological constant depends on the form and mode of energy use and on energy-use efficiency. The technological constant will increase in value with technology advancement. The parameter A may be estimated by regression analysis. We find:
The utility of Eq. (10) may be checked.17-19 From T tests, t = 61.10 and the tabulated value is 1.98 at the 5% level of significance.18 This large value of t leaves little doubt that PQLI and ln(kWh/cap) are linearly related as specified.
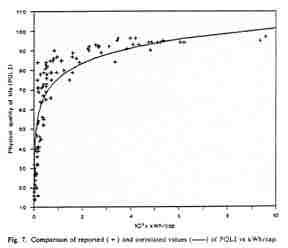
Fig. 7. Comparison of reported ( + ) and correlated values ( — ) of PQLI vs kWh/cap.
Other measures of the utility of our model are the coefficient of correlation r and rank correlation coefficient r(rank), where r = 0.89 and r(rank) -0.98. These large values confirm the conclusion that PQLI and ln(kWh/cap) are highly correlated.
Figure 7 shows the correlation between PQLI and kWh/cap. The agreement is fairly good. Figure 8 shows the residuals (PQLIi - PQL1i) vs ln(kWh/cap). Since the residuals are randomly scattered about the reference tine, we have additional evidence that our regression model correlates the data well.
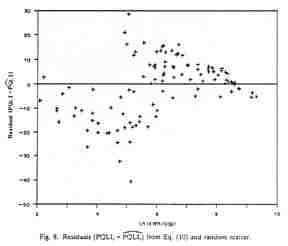
Fig. 8. Residuals (PQLIi - PQL1i) from Eq. (10) and random scatter.
REFERENCES- M. Martin, "Economic and Social Indicators of Development, by Income Groups and by Region," in Energy in the Developing World, pp. 372-386, Oxford University Press. Oxford (1980).
- A. Makhijani and A. Poole, Energy and Agriculture in the Third World, Chap. 1, Ballinger, Cambridge, MA (1975).
- K. Openshaw, "The Gambia: A Wood Consumption Survey and Timber Trend Study, 1973-2000)," unpublished report to the ODA/LRD Gambia Land Resources Development Project, Midlothian, U.K. (1973).
- A. Malthijani, "Energy in the Rural Third World," pp. 14 21 in Ref. 1.
- V, Dalal, J. Energy Convers. 13, 85 (1973).
- V. Smil, "China's Energetics: A System Analysis," pp. 112-144 in Ref. 1.
- V. Smil and W. E. Knowland, "Energy and Development," pp. 1-13 in Ref. 1.
- R. Revelle, "Energy Use in Rural India," pp. 194-207 in Ref. 1.
- M. A. Rahman and A. M. Z. Huq, "Energy Resources in Bangladesh-Problems and Prospects," pp. 320-351 in Ref. 1.
- J. Brisco and Bari, "The Political Economy of Energy in Rural Bangladesh: A View from a Village," Division of Applied Science, Harvard University, Cambridge, MA. (1979)
- G. D. Friedlander, IEEE Spectrum, pp. 18-27 (May 1973).
- A. Hoque, S. F. Rahman, and A. M. Z. Huq, "Rural Energy in Bangladesh," Proceedings of the International Seminar on Agriculture to Industry: The Role of Engineering, Inst. of Engineers, Bangladesh (1980).
- J. W. Forrester, World Dynamics, Wright Allen Press, Boston, MA (1971).
- M. S. Islam, "Housing and the Quality of Life: An Analysis of Regional Variations in Urban Delhi." unpublished Ph.D. Thesis submitted to The Center for the Study of Regional Development, School at Social Science, Jaherlal Nehru University, New Delhi (1982).
- M. S. Alarn, A. M. Z. Huq, and B. K. Bala, Energy 15, 131 (1990).
- Department of Economic and Social Affairs, United Nations, "World Energy Supplies 1950-1974," New York, NY (1976).
- N. G. Damodar, Basic Econometrics, 2nd edn, pp. 165-308, McGraw-Hill, New Delhi (1988).
- M. R. Bethea, S. B. Duran, and L. T. Boullion, Statistical Methods for Engineers and Scientists, pp. 301 423, Marcel Dekker, New York, NY (1985).
- T. J. McCare and P. G. Benson, Statistics for Business and Economics, pp. 292-424, Dellen, San Francisco, CA (1979).