
|
|
The Republic of Hungary is located in central European, and shares borders with Slovakia to the north, Ukraine and Romania to the east, Slovenia and Austria to the west, and Yugoslavia and Croatia to the south. Hungary is about the size of Pennsylvania, and its population is estimated at 10.2 million. There are 19 administrative regions (called 'megyek') in Hungary; these are shown in Figure 1. The capital city, Budapest, is located in the north central part of the country, surrounded by Pest county, and has a population of about 1.9 million. Hungary's currency, the Forint, equals approximately $.0044, or 226 Forints equal one U.S. dollar (as of February 2003). In 2000, the estimated GDP of Hungary was $113.9 billion (purchasing power parity).
Hungary is a member of the Central European Free Trade Agreement (CEFTA), which includes the Slovak Republic, the Czech Republic, Poland, and Slovenia. In 1998 Hungary became a member of the North Atlantic Treaty Organization (NATO) and in December 2002 it was one of the ten countries invited to membership in the major expansion of the European Union (which will supercede CEFTA). Hungary is also a member of the World Trade Organization, the International Monetary Fund, the World Bank, and the European Bank for Reconstruction and Development.
The Hungarian Government has an official energy policy to:
Hungary's energy policy is oriented toward achieving EU accession, which is expected to happen in 2004. The 1999 energy plan issued by the government of Hungary indicates a movement toward cleaner technologies, including emissions controls for coal-fired generation and eventual replacement of some coal-fired power plants with gas turbines. The 2001 Electricity Act brings the Hungarian electricity market into accord with EU directives in terms of third party access to the electricity grid and removal of subsidies, and defines a market structure that includes electricity generation companies, electricity distributors, power traders, and an electricity grid operator.
The Hungarian government is committed to liberalizing the electricity and natural gas markets. The Hungarian Energy Office was created in the early 1990s in anticipation of the changes that are only starting to happen now; it is responsible for licensing for producers of gas and electricity, it determines (but does not set) tariffs for third party access to electricity, gas, and district heat transmission systems, and is the lead organization for consumer protection and investigation of any complaints. One of the Office's main activities is expected to be handling market-related problem areas. Funding for the Office comes from fees paid by licenses purchased in the electricity, natural gas, and district heating subsectors.
There will be a gradual introduction of competition to the electricity market. In 2003, the largest industrial users, constituting about 35% of total consumption, will be allowed to choose their electricity suppliers. Third party access to the grid will begin then, and independent power suppliers will be allowed to "wheel" power through the grid, though the grid operator will be allowed to add a transport/access tariff. This competitive market is expected to eventually result in a rate decrease of as much as 15% for customers. One effect of this liberalization plan is the creation of two parallel markets for electricity. The transitional public utility market will still have an official price for electricity, with the Hungarian national electricity company, MVM, as the wholesaler; this will cover the 65% of the market not initially affected by the first stage of market liberalization, and will gradually diminish as the competitive market expands. The public utility market should entirely disappear no later than 2010.
MVM has created a new company, MAVIR, which will handle electricity dispatch and balance for the grid, though MVM itself will still own the grid and collect the revenues from its use. Presently, MAVIR is a 100%-owned subsidiary of MVM, though once it is operational the ownership is supposed to revert to the Ministry of Economic Affairs. MVM will also create, as part of its privatization, separate electricity trading, wholesaling, and transmission companies. However, exactly when all of this will occur is not yet definite, as the privatization scheme for MVM has not yet been fully worked out.
Preliminary plans call for a major changeover from coal power plants to gas turbines over the next three or four years. Under these plans, there would eventually be only one coal power plant left, the Matra plant in the north of Hungary. This is a lignite mine-mouth plant that currently produces 13% of Hungary's electricity. It is estimated that changing a 200 megawatts (MWe) plant from coal to gas turbines takes two years and costs $60-$80 million for the equipment. Under Hungary's policies, the cost of rehabilitating the land previously used for coal mining for a plant will be included in the price of electricity. Integration of steam coal-producing mines to power companies mostly took place prior to the first wave of privatization, in 1995.
Domestic energy production (from oil, gas, nuclear power, low calorific coal and lignite) meets approximately half of Hungary's energy requirements. The remaining energy need is met from oil imports. Domestic oil production has peaked, so when energy consumption begins to rise, dependency on oil imports will also likely rise. Table 1 shows Hungary's past and projected future primary energy supply by fuel type.
| Fuel Type | 1990 | 1996 | 1997 | 2000 | 2005 | 2010 |
| Coal | 6.12 | 4.60 | 4.35 | 4.01 | 4.63 | 5.38 |
| Oil | 8.52 | 6.85 | 6.98 | 7.16 | 7.52 | 7.75 |
| Natural Gas | 8.90 | 10.22 | 9.70 | 10.06 | 10.23 | 10.32 |
| Nuclear | 3.58 | 3.70 | 3.64 | 3.65 | 3.65 | 3.65 |
| Hydroelectric | 0.02 | 0.02 | 0.02 | 0.02 | 0.02 | 0.05 |
| Other * | 0.37 | 0.22 | 0.44 | 0.99 | 1.03 | 1.08 |
| Total | 28.46 | 25.80 | 25.31 | 26.09 | 27.28 | 28.40 |
An historical summary of Hungary's Total Primary Energy Production (TPEP) and Consumption (TPEC) is shown in Table 2.
| 1990 | 1991 | 1992 | 1993 | 1994 | 1995 | 1996 | 1997 | 1998 | 1999 | 2000 | |
| TPEP | 0.61 | 0.57 | 0.56 | 0.53 | 0.53 | 0.52 | 0.51 | 0.53 | 0.49 | 0.47 | 0.45 |
| TPEC | 1.25 | 1.16 | 1.08 | 1.06 | 1.06 | 1.06 | 1.09 | 1.07 | 1.07 | 1.07 | 1.05 |
Oil
Exploration and
Reserves
The Hungarian Oil and Gas Company (MOL) is one of central
Europe's largest integrated oil and gas companies, and is the largest company in
Hungary in terms of sales. It recently acquired a 36% stake in the Slovakian oil
refining company Slovnaft, and expects to increase its share to 50% in the
relatively near future. MOL's domestic oil fields are expected to decline in
production rate by about 6-9% annually, so MOL has formed a production sharing
agreement with the Russian company Yukos for joint development of the
Zapadno-Maloblyk field in Siberia, which contains an estimated 175 million
barrels of proven reserves. MOL also has exploration activities underway in
Yemen, Pakistan, and Syria.
Production and Consumption
Oil production
in Hungary is far less than consumption. By 2010, oil production is estimated to
be decrease to about 15,000 barrels per day (b/d), while annual consumption is
expected to increase by by about 3.8%. This increased demand is expected to be
mainly for light petroleum products, particularly gasoline and jet fuel.
An historical summary of petroleum production and consumption in Hungary is shown in Table 3.
| 1990 | 1991 | 1992 | 1993 | 1994 | 1995 | 1996 | 1997 | 1998 | 1999 | 2000 | |
| Production (total)* | 55 | 47 | 46 | 45 | 50 | 46 | 42 | 50 | 43 | 41 | 42 |
| Production (Crude Oil only) | 40 | 34 | 33 | 34 | 39 | 35 | 32 | 35 | 26 | 24 | 27 |
| Consumption | 179 | 161 | 171 | 166 | 168 | 160 | 148 | 153 | 159 | 154 | 145 |
Refineries and Downstream Processing
There
are three oil refineries in Hungary (all owned by MOL), the largest of which is
the 161,000 b/d capacity Szazhalombatta refinery, located along the Danube
River in Pest megyek, about 30 kilometers south of Budapest. In 2001, MOL shut
down the two other refineries, the 61,000 b/d Tiszaujvaros facility and the
10,000 b/d Zalaegerszeg facility, for cost-cutting reasons, though it has
been reported that the Zalaegerszeg refinery (located in western Hungary in Zala
megyek) will re-open as an asphalt plant.
An historical summary of refined petroleum products output by fuel type in Hungary is shown in Table 4.
| Refined Product | Production Rate | |||||||||
| 1990 | 1991 | 1992 | 1993 | 1994 | 1995 | 1996 | 1997 | 1998 | 1999 | |
| Motor Gasoline | 28 | 24 | 33 | 30 | 29 | 33 | 31 | 33 | 34 | 33 |
| Jet Fuel | 6 | 5 | 5 | 3 | 5 | 4 | 4 | 4 | 4 | 4 |
| Kerosene | 1 | 1 | 1 | 2 | 2 | 2 | 2 | 2 | 0 | 0 |
| Distillate Fuel Oil | 57 | 54 | 59 | 54 | 52 | 52 | 50 | 53 | 53 | 52 |
| Residual Fuel Oil | 35 | 35 | 33 | 38 | 31 | 30 | 26 | 27 | 25 | 30 |
| Liquefied Petroleum Gases | 4 | 3 | 4 | 3 | 3 | 3 | 3 | 10 | 10 | 9 |
| Lubricants | 4 | 4 | 4 | 5 | 7 | 10 | 5 | 7 | 7 | 3 |
| Other * | 26 | 29 | 28 | 30 | 42 | 36 | 30 | 34 | 38 | 36 |
| Total Output | 160 | 154 | 167 | 165 | 171 | 170 | 153 | 169 | 171 | 167 |
| Refinery Fuel and Loss | 7 | 6 | 6 | 6 | 7 | 7 | 6 | 7 | 7 | 6 |
Natural Gas
Natural gas reserves are about
3.4 trillion cubic feet (TCF). In 1998, natural gas production was 137
billion cubic feet (BCF). To meet the domestic demand of approximately
433 BCF, Hungary imports natural gas from the Russian Federation. It is
estimated that natural gas production in 2010 will decline approximately
109 BCF, while natural gas demand is expected to increase to approximately
520 BCF. No natural gas is exported. Hungary's underground gas storage
capacity is well developed; storage accounts for 120 days of peak winter
imports. Natural gas storage capacity has expanded at a rate greater than demand
growth. As of 1996, nine companies were licensed as natural gas suppliers and
three were licensed as liquefied natural gas (LNG) suppliers.
An historical summary of natural gas production and consumption in Hungary is shown in Table 5.
| 1990 | 1991 | 1992 | 1993 | 1994 | 1995 | 1996 | 1997 | 1998 | 1999 | 2000 | |
| Production | 0.172 | 0.176 | 0.179 | 0.178 | 0.171 | 0.173 | 0.165 | 0.154 | 0.137 | 0.120 | 0.113 |
| Consumption | 0.394 | 0.393 | 0.349 | 0.372 | 0.375 | 0.407 | 0.453 | 0.431 | 0.433 | 0.437 | 0.425 |
An OECD report on Hungary's energy sector, published in 1998, estimated that 15% of Hungary's natural gas comes from wells within Hungary and 85% is imported from Russia's Gazprom. The report estimated that 40% of Hungary's natural gas consumption is residential and the remaining 60% is industrial.
Natural gas transmission is also run by MOL. MOL is presently the only gas wholesaler, and it sells 76% of its gas to nine distribution companies and the remaining 24% directly to large industrial companies (the largest of which are two utility power plants, at Dunamenti and Tisza). Sales to the nine distribution companies are covered by long-term agreements. In October 2000, MOL accepted a proposal that its gas transmission, storage, and trading operations be unbundled into separate entities. Three separate companies for these purposes have been established, though asset transfer and start-up of operations has yet to occur.
Over the past ten years, Hungary has gradually raised industrial and household natural gas prices, with removal of subsidies. During the mid part of the 1990s, residential users saw their rates more than double in a span of just two years, and the residential rate for natural gas is now more than quadruple what it was a decade ago. Industrial users also saw significant price increases, and now, with progressive removal of residential subsidies, pay rates lower than residential users. A full liberalization of natural gas prices is expected no later than the year 2005. An historical summary of average natural gas prices in Hungary is shown in Table 6.
| Year | 1991 | 1992 | 1993 | 1994 | 1995 | 1996 | 1997 | 1998 | 1999 | 2000 |
| Industrial Customers |
1.18 | 1.02 | 1.01 | 1.13 | 1.30 | 1.61 | 2.09 | 2.36 | 2.47 | 2.47 |
| Residential Customers |
0.70 | 0.86 | 0.97 | 0.91 | 1.50 | 1.93 | 2.46 | 2.95 | 3.00 | 3.00 |
Coal
Recoverable reserves of hard coal are 600 to
700 million short tons; reserves for lignite are 3,000 million short
tons; and reserves of brown coal are 1,000 million short tons. Most
Hungarian coal is high in sulfur and ash. The only reasonable possibility for
greatly increasing new coal mining capacity would be from lignite. Hungary's
lignite resources are estimated to be adequate to justify an additional 900 to
1,000 MWe of lignite-fueled electricity generating capacity.
There are three types of coal mined in Hungary -- brown coal (i.e., sub-bituminous), black coal (i.e., bituminous) and lignite. The brown coal has a heating value of 10,000 to 14,000 kilojoules per kilogram (kJ/kg) and has more than 1% sulfur content. Because of this high sulfur content, power plants that burn brown coal must have some kind of flue gas desulfurization equipment. There are seven brown coal mines in Hungary, of which two have annual output over one million metric tons. All of the brown coal mines in Hungary are underground mines.
There are only two black coal mines in Hungary; both are open pit mines and are located in the southern part of Hungary. Black coal in Hungary is difficult and expensive to mine because the seams are relatively thin and often steeply sloped. These coal seams also contain significant amounts of methane, which so far has proven difficult to extract economically for use as a fuel.
The predominant coal mining activity in Hungary is for lignite, which has a heating value of about 6,000 to 8,000 kJ/kg. There are nine underground and nine open pit lignite mines in Hungary. Seven of the nine underground mines are adjacent to power plants that use the coal, while two very small underground mines (less than 10,000 metric tons per year) are located near municipalities where the lignite is used for home heating.
An historical summary of coal production and consumption in Hungary is shown in Table 7.
| 1990 | 1991 | 1992 | 1993 | 1994 | 1995 | 1996 | 1997 | 1998 | 1999 | 2000 | |
| Production Anthracite Bituminous Lignite |
19.65 n/a 2.19 17.46 |
18.89 n/a 2.03 16.86 |
17.45 n/a 1.43 16.02 |
16.11 n/a 1.05 15.06 |
15.55 n/a 1.14 14.42 |
16.08 n/a 0.94 15.14 |
16.74 n/a 0.97 15.77 |
17.18 n/a 0.94 16.24 |
17.05 n/a 0.90 16.15 |
16.82 n/a 0.79 16.04 |
15.30 n/a 0.69 14.61 |
| Consumption | 22.95 | 22.32 | 21.04 | 19.96 | 18.53 | 18.61 | 19.22 | 19.28 | 18.97 | 19.09 | 17.19 |
Because of the Hungarian government's 1999 announcement of its plans for phasing out several coal power plants, there has been opposition from the coal industry. In December 1999, over 2000 coal miners gathered in Budapest to protest the plan, which would lead to reduced employment in the coal industry.
NuclearThe Paks power plant has four Soviet-designed VVER-440/213 pressurized light water reactors, which were put into operation between 1982 and 1987. It was initially planned that these reactors would have a 30-year life, but the operators of the plant are now planning for a 10-year life extension. EU safety experts have indicated that Paks is as safe as western nuclear power plants and will comply with EU standards by 2002. Paks has had an excellent safety record and has been ranked in the top 10 percent of reactors worldwide.
Regulation of nuclear safety is under the Hungarian Atomic Energy Authority, which serves as the operating body of the Hungarian Atomic Energy Commission. The Authority employs approximately ten inspectors on-site at Paks.
Since the reorganization of January 1, 1992, the plant has been operated by Paks Nuclear Power Plant Ltd. At that time, the recorded capital of the company was 126.598 billion Hungarian forints. Hungarian Power Companies Ltd (MVM) owns 99.8674% of the stock in Paks Nuclear Power Plant Ltd. State Privatization Property Ltd. owns 0.0001% and the rest is shared among the involved municipalities. In 1998, Paks Nuclear Power Plant Ltd. had a net income of 62,800 million Hungarian forints and a pre-tax result of 2,000 million Hungarian forints.
Hydroelectric Power and Other Renewable EnergyHungary is one of the less mountainous countries in central Europe, and
therefore has only limited hydroelectric potential. There are only three small
commercial hydroelectric power plants in the country, and these are summarized
in Table 8.
| Power Plant | Capacity (MWe) |
River |
| Hernádviz | 4.4 | Hernád |
| Kisköre | 28 | Tisza |
| Tiszalök | 11.4 | Tisza |
The Hernádviz power plant is owned by Hungarian Innoventa 2001 Ltd., while the Kisköre and Tiszalök power plants are owned by Tiszavíz Hydro Power Plants Ltd. The new owner of the small Hernádviz power plant is the Hungarian subsidiary of the German company Innoventa Energy AG; previously the power plant had been owned by a retired teacher who had purchased it in 1997 from the Hungarian government for 200 million forints, but subsequently and in violation of the privatization agreement, could not invest further in the facility.
Other Renewable Energy
Hungary's first
wind power plant is a small facility located near the Danube River about 40
miles south of Budapest. The cost of the plant was about $700,000, and it is
expected to provide enough electricity for about 750 residences.
Energy Transmission Infrastructure
Electricity Grid
Hungary has electricity
high-voltage transmission lines of 750 kilovolts (kV), 400 kV, and
220 kV; these measure approximately 270, 1,730, and 1,200 kilometers in
overall length, respectively. There is also a 120 kV grid which is directly
supplied by many of Hungary's power plants, inclucing the Paks nuclear power
plant. The main power transmission line linking Hungary to the east is a
750 kV line from Ukraine. A Diagram of Hungary's higher voltage electricity
transmission grid is shown in Figure 2.
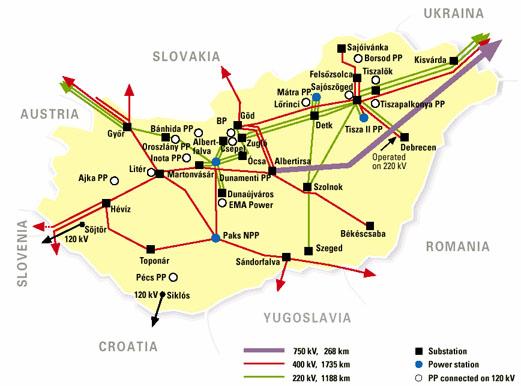
In recent years, the Hungarian power system has become integrated into the power system of Western Europe. The connection of the Hungarian system to the West-European UCPTE system was completed in 1995. A 400 kV interconnection was put into operation between Hungary and Croatia in November 1999.
Natural Gas Pipelines and Storage
Natural
gas transmission is run by MOL. Currently, there are 65,000 kilometers of gas
line in Hungary. Of these, MOL operates about 5,200 kilometers of high pressure
lines, which deliver gas to customers. New compressor stations were recently
constructed at Mosonmagyaróvár and Hajdúszoboszló, which will enable MOL to more
easily reach gas markets south of Hungary.
MOL has about 3.2 billion cubic meters of underground gas storage capacity available. There are presently four underground storage sites: Pusztaederics, Pusztaszölös, Hajdúszoboszló, and Szana. The Pusztaszölös site recently suffered damage from a blowout, where 130 million cubic meters of stored gas was lost.
Oil Pipelines
Hungary relies heavily on
the Russian Federation to meet its oil import needs. The main pipeline from
Russian oil is the Southern Druzhba pipeline, which runs westward through
Ukraine into Hungary. The Adria pipeline, which runs north into Hungary from the
terminal at Krk Island on Croatia's Adriatic coast, could also be used as a
supply of oil, though Russia is much more interested in improving this pipeline
so that it can be used for exporting oil instead. There are also about 1,200
kilometers of oil product pipelines in Hungary; all the crude oil and oil
product pipelines are owned by MOL.
A diagram of Hungary's crude oil and oil products pipelines is shown in Figure 3.
Electricity
Installed
Capacity
Of the 49 power generating units (of all types) in the
Hungarian power system, only 16 have installed capacities greater than
100 MWe. Those 16 units represented 94% of the total capacity in 2000. An
historical summary of installed electricity generating capacity in Hungary is
shown in Table 9.
| 1990 | 1991 | 1992 | 1993 | 1994 | 1995 | 1996 | 1997 | 1998 | 1999 | 2000 | |
| Hydroelectric | 0.05 | 0.05 | 0.05 | 0.05 | 0.05 | 0.05 | 0.05 | 0.05 | 0.05 | 0.05 | 0.05 |
| Nuclear | 1.65 | 1.76 | 1.76 | 1.84 | 1.84 | 1.84 | 1.84 | 1.84 | 1.84 | 1.84 | 1.84 |
| Geothermal/Solar/ Wind/Biomass |
n/a | n/a | n/a | n/a | n/a | n/a | n/a | n/a | 0.00 | 0.00 | 0.00 |
| Conventional Thermal | 5.09 | 5.38 | 5.39 | 5.39 | 5.52 | 5.43 | 5.52 | 5.65 | 5.65 | 5.96 | 5.95 |
| Total Capacity | 6.79 | 7.18 | 7.19 | 7.28 | 7.40 | 7.31 | 7.40 | 7.54 | 7.53 | 7.85 | 7.84 |
Generation and Consumption
Electricity
demand in 2005 is estimated to be from 42 billion kilowatt-hours (kWh) to
54 billion kWh. Energy sources for electricity demand for the years 1999
and 2000 are shown in Table 10.
| Energy Source | 1999 Demand | Percent of Total |
2000 Demand | Percent of Total |
| Coal | 9.9 | 26.1 | 9.2 | 24.0 |
| Oil & Natural Gas | 12.0 | 31.7 | 10.8 | 28.2 |
| Nuclear | 14.1 | 37.2 | 14.2 | 37.1 |
| Autoproducers & Hydro | 0.8 | 2.1 | 0.7 | 1.8 |
| Net Imports | 1.1 | 2.9 | 3.4 | 8.9 |
| TOTAL | 37.9 | 100.0 | 38.3 | 100.0 |
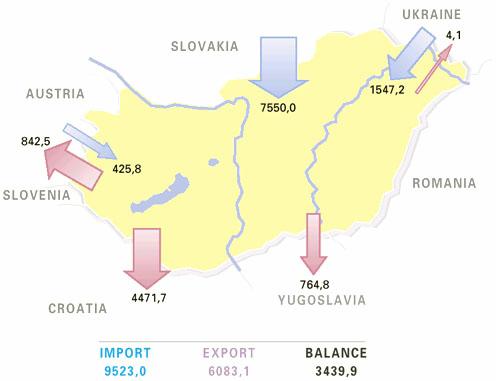
In 1990, Hungary had imported 12.2 billion kWh per year from Ukraine. However, by 2000, the net imports from Ukraine had shrunk to 1.54 billion kWh per year, as Hungary integrated its electric transmission with its Western neighbors. In 2000, Slovakia was Hungary's main source of imported electric power with 7.55 billion kWh per year in electricity purchases. A diagram of Hungary's international electricity trade for the year 2000 is shown in Figure 4.
An historical summary of electricity generation, consumption, imports, and exports for Hungary (according to DOE's Energy Information Administration) is shown in Table 11.
| 1990 | 1991 | 1992 | 1993 | 1994 | 1995 | 1996 | 1997 | 1998 | 1999 | 2000 | |
| Net Generation hydroelectric nuclear geo/solar/wind/biomass conventional thermal |
26.9 0.2 13.0 n/a 13.7 |
28.3 0.2 13.0 n/a 15.1 |
29.9 0.2 13.3 n/a 16.5 |
31.1 0.2 13.1 n/a 17.8 |
31.7 0.2 13.3 n/a 18.1 |
32.1 0.2 13.3 n/a 18.6 |
33.1 0.2 13.5 n/a 19.5 |
33.4 0.2 13.3 n/a 19.9 |
35.2 0.2 13.3 0.1 21.7 |
35.2 0.2 13.4 0.1 21.5 |
33.4 0.2 13.5 0.1 19.7 |
| Net Consumption | 36.3 | 33.7 | 31.2 | 31.4 | 31.5 | 32.3 | 33.0 | 33.2 | 33.5 | 33.8 | 35.1 |
| Imports | 13.3 | 8.4 | 4.9 | 3.3 | 3.0 | 3.2 | 3.5 | 4.4 | 4.0 | 3.4 | 5.2 |
| Exports | 2.0 | 1.1 | 1.5 | 0.8 | 0.9 | 0.8 | 1.3 | 2.3 | 3.3 | 2.3 | 1.2 |
Over the past ten years, Hungary has sharply raised industrial and household electricity prices, with removal of subsidies. During the mid part of the 1990s, residential users saw their rates triple in a span of just four years, and the residential rate for electricity is now more than six times what it was a decade ago. Industrial users also saw significant price increases, and now, with removal of residential subsidies, pay rates lower than residential users. An historical summary of electricity prices in Hungary is shown in Table 12.
| Year | 1991 | 1992 | 1993 | 1994 | 1995 | 1996 | 1997 | 1998 | 1999 | 2000 |
| Industrial Customers |
0.018 | 0.018 | 0.017 | 0.017 | 0.021 | 0.024 | 0.033 | 0.041 | 0.047 | 0.049 |
| Residential Customers |
0.009 | 0.010 | 0.013 | 0.015 | 0.022 | 0.029 | 0.041 | 0.046 | 0.053 | 0.058 |
Electric Industry Overview
Until 1992, the
electricity industry was managed by the Hungarian Power Company -- Magyar
Villamos Müvek Reszvenytarsag (MVM). In 1992, Hungary reorganized MVM into a
two-tier company structure. The upper tier, which remained MVM, manages all
trade in electricity. MVM owns and operates the high voltage transmission grid
and dispatching center. It purchases power from electricity generating companies
and sells it to smaller distribution companies. MVM controls the financial flow
of electricity-based goods and services by the use of tariffs. It also manages
all electricity-related import and export transactions.
The second tier of the utility system is comprised of several independent generating companies; six regional distribution companies; and one maintenance company for the basic network. The non-hydroelectric power plants in Hungary are listed in Table 13.
| Generating Company |
Power Station |
Capacity (MWe) |
Fuel |
| AES Tisza II Power Plant Ltd. |
Tisza 2 | 860 | heavy fuel oil & natural gas |
| Bakony Power Company * |
Ajka | 102 | coal |
| Inota | 52 | coal | |
| Inota GT | 170 | fuel oil | |
| Borsod Energetic Ltd. |
Borsod | 137 | coal |
| Tiszapalkonya | 200 | coal | |
| Budapest Power Company |
Kelenföld | 262 | natural gas & fuel oil |
| Dunamenti Power Company |
Dunamenti | 1,740 | natural gas & heavy fuel oil |
| Dunamenti GT | 386 | natural gas | |
| EMA-Power Ltd. | Dunaújváros CHP | 69 | fuel oil, natural gas, blast furnace and coke oven gases |
| Mátra Power Company * |
Mátra | 836 | lignite |
| MVM Reserve Gas Turbine Power Plants |
Litér GT | 120 | fuel oil |
| Lörinci GT | 170 | fuel oil | |
| Sajószöged GT | 120 | fuel oil | |
| Paks Power Company |
Paks | 1,851 | enriched uranium |
| Pécs Power Company * |
Pécs | 190 | coal |
| Powergen Ltd. | Csepel I | 42 | natural gas & fuel oil |
| Csepel II | 396 | natural gas & fuel oil | |
| Vértes Power Company * |
Bánhida | 100 | coal |
| Oroszlány | 235 | coal | |
| East Hungarian Electricity Supply Company (TITASZ) |
Debrecen GT | 170 | natural gas |
The majority of the power companies in Hungary are now the property of investors, rather than the Hungarian government. However, the Paks nuclear power plant and the National Power Line Company are nearly 100% owned by MVM, the state-owned utility. The role of MVM is the control of the power system, electricity transmission, wholesale sales, imports, and exports. MVM buys electricity from the power plants and import sources and sells it to the distribution companies.
When the generating companies were privatized in the early 1990s, the power plants were privatized in package deals with their associated coal mines. The Matra Power Company encompassed the Visonta and Bukkabrany lignite surface mines. The Bakony Power Company included the Padrag, Armin, Jokai, and Balinka coal mines. The Pecs Power Company got the Kulfejtes and Komlo mines. The Vertes Power Company got the Oroszlany and Many mines. As originally structured, the Tisza Power Company included the Borsod, Tiszapalkonya, and Tisza 2 power plants, the Borsod coal plant, and the Lyukobanya mine. Later it was decided that the Borsod and Tiszapalkonya power plants would be separately privatized as Borsod Energetic Limited. Transfers of coal properties to power companies was accomplished by giving a one quarter share to SZESZEK, the Hungarian Coal Mining Restructuring Company.
Utility Expansion Plans
The MVM is
planning a retrofit of 300-700 MWe of existing capacity and had planned to
construct new plants of 1,000-1,100 MWe capacity by the year 2006. This new
capacity expansion was internationally tendered in 1997 by MVM, but pending
privatization and breakup of MVM has resulted in these plans being put on hold.
A summary of MVM's planned future power plants is shown in Table 14.
| Power Station | Power Generation Technology |
Capacity | Status |
| Ujpest | Gas Turbine with Steam Turbine |
70 MWe 33 MWth |
Being Commissioned |
| Inota | Coal-fueled Atmospheric Fluidized-Bed Unit |
150 MWe | Unlikely to be built |
The Debrecen power plant (170 MWe combined cycle), built by the TITASZ supply company, has recently come online. Two other combined cycle plants are being built as the result of capacity tenders originally announced in 1997 -- a 191 MWe plant of AES FONIX is under construction at the site of the Tisza II power plant, and Budapest Power Plant Ltd is constructing a 110 MWe plant at the site of the Power Plant Kispest. Combined cycle gas turbine power plants are rapidly gaining in popularity in Hungary. EMA-Power is considering constructing a combined cycle gas turbine power plant at their site in Dunaújváros that could be as large as 120 MWe. Two other gas turbine combined cycle power plants reportedly under development are to be located at Pécs and Ajka; the Pécs facility could have a generating capacity of as much as 270 MWE, while the Ajka facility would probably have a capacity of about 110 MWe. MOL has taken a 30% stake in a joint venture with BorsodChem Ltd. which is in the final stages of constructing a gas turbine power plant that will have a capacity of 50 MWe as well as about 130 megawatts of thermal capacity. Finally, the Russian-owned Central European Steel group is planning to open a joint venture with an American power developer to build a 590 MWe coal-fueled power plant near the Ukraine border.
Air pollution is the most significant environmental issue facing the energy sector. Approximately 44% of the Hungarian population lives in areas that do not comply with national air quality standards. A significant contributor to air pollution is abundant use of high sulfur, low calorific value, domestic coal and lignite, which are major sources of sulfur dioxide (SO2). However levels of oxides of nitrogen (NOx), particulates and carbon monoxide (CO) are also of concern. Although many power plants are equipped with electrostatic precipitators, the effectiveness of these systems vary considerably. Wastes from open pit and deep coal mining are also of concern, particularly as a growing number of mines are being closed and clean-up responsibility is unclear. Water pollution from industrial activity is a significant problem along the Danube and Tisza rivers.
Historical and projected anthropogenic SO2, NOx, CO, and non-methane volatile organic compounds (NMVOCs) emissions in Hungary are shown in Table 15.
| Component | 1990 | 1991 | 1992 | 1993 | 1994 | 1995 | 1996 | 1997 | 1998 | 1999 | 2010 |
| SO2 | 1,010 | 913 | 827 | 757 | 741 | 705 | 673 | 659 | 592 | 590 | 550 |
| NOx | 238 | 203 | 183 | 184 | 187 | 190 | 196 | 200 | 203 | 221 | 198 |
| CO | 997 | 913 | 836 | 796 | 774 | 761 | 727 | 733 | 737 | 755 | 800 |
| NMVOCs | 205 | 150 | 142 | 149 | 142 | 150 | 150 | 145 | 141 | 149 | 137 |
Hungary has signed a number of international agreements and accords on the environment, including the United Nation's Framework Convention on Climate Change, which was signed and ratified; as well as EU and other agreement to control transboundary emissions. An historical summary of carbon dioxide (CO2) emissions from fossil fuel use in Hungary is shown in Table 16.
| Component | 1990 | 1991 | 1992 | 1993 | 1994 | 1995 | 1996 | 1997 | 1998 | 1999 | 2000 |
| CO2 from coal | 5.80 | 5.89 | 5.53 | 4.64 | 4.44 | 4.21 | 4.37 | 4.31 | 4.19 | 4.29 | 3.85 |
| CO2 from natural gas | 5.64 | 5.61 | 4.92 | 5.30 | 5.36 | 5.83 | 6.50 | 6.17 | 6.20 | 6.29 | 6.11 |
| CO2 from petroleum | 6.96 | 6.30 | 6.75 | 7.03 | 6.82 | 6.00 | 5.31 | 5.55 | 5.62 | 5.23 | 4.92 |
| Total CO2 from all fossil fuels |
18.41 | 17.80 | 17.21 | 16.97 | 16.62 | 16.03 | 16.17 | 16.03 | 16.01 | 15.80 | 14.88 |
Since 1990, the Hungarian government has been transitioning to a market economy following earlier attempts at partial economic reform. The government has made progress in adapting its energy industries to a market economy.
The privatization of electricity sector generating and distribution companies is practically finished. Privatization of the MVM, which plays a determinant role in the electricity sector, the MVM-owned Paks Nuclear Power Plant, and the National Grid Company will begin later.
Privatization of MOL has taken place mainly from acquisition of shares by institutional investors, both international and within Hungary. In December 1995, the Hungarian State Privatization and Holding Company held about 88% of the shares of MOL; by March 1998 this had declined to 25%. International institutional investors now hold about 52% of the shares of MOL, while Hungarian private institutional investors hold more than 16% of the shares.
Hungary's economic reforms during the communist era gave it a head start on the privatization process, particularly in terms of attracting foreign investors. Hungary has accounted for about half of all foreign direct investment in Eastern Europe since 1989. Overall, about half of GDP now originates in the private sector. Unemployment was 9.4% in 2000, while inflation was slightly below ten percent for the first time since the end of the communist era. An historical summary of Hungary's GDP growth rate, inflation, and exchange rate is shown in Table 17.
| Component | 1990 | 1991 | 1992 | 1993 | 1994 | 1995 | 1996 | 1997 | 1998 | 1999 |
| Annual GDP Growth Rate* (percent) |
-3.5 | -11.5 | -3.0 | -0.8 | 2.9 | 2.0 | 1.3 | 4.6 | 4.9 | 4.5 |
| End-of-Year Inflation (percent) |
28.9 | 34.2 | 22.9 | 22.5 | 18.8 | 28.2 | 23.6 | 18.3 | 14.3 | 10.0 |
| Exchange Rate (Forints/US$) |
63.2 | 74.7 | 79.0 | 91.9 | 105.1 | 125.7 | 152.6 | 186.8 | 214.5 | 237.3 |
In 2001, Hungary had $27.9 billion of exports, which included machinery and equipment, miscellaneous manufactures, agricultural and food products, raw materials, fuels and electricity. There were $29.5 billion of imports in 2001, which included machinery and equipment, other manufactures, fuels and electricty, agricultural and food products, and raw materials. Germany, Austria, and Italy were the major trading partners.
| For more information, please contact our Country Overview Project Manager: |
Richard
Lynch U.S. Department of Energy Office of Fossil Energy 1000 Independence Avenue Washington, D.C. 20585 USA telephone: 1-202-586-7316 |
 |
Return to Hungary
page |
| last updated
on February 11, 2003 | Comments On Our Web Site Are Appreciated! |