|
|
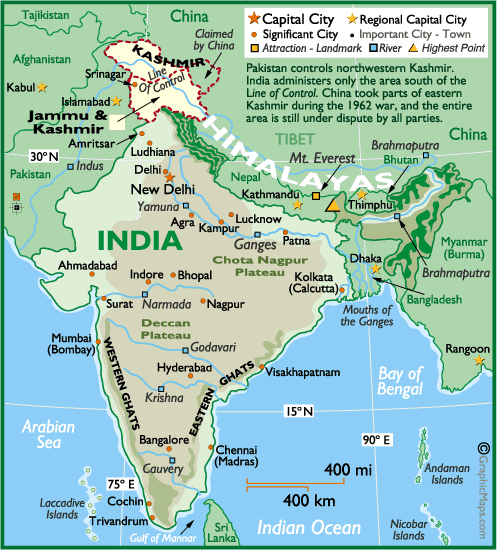
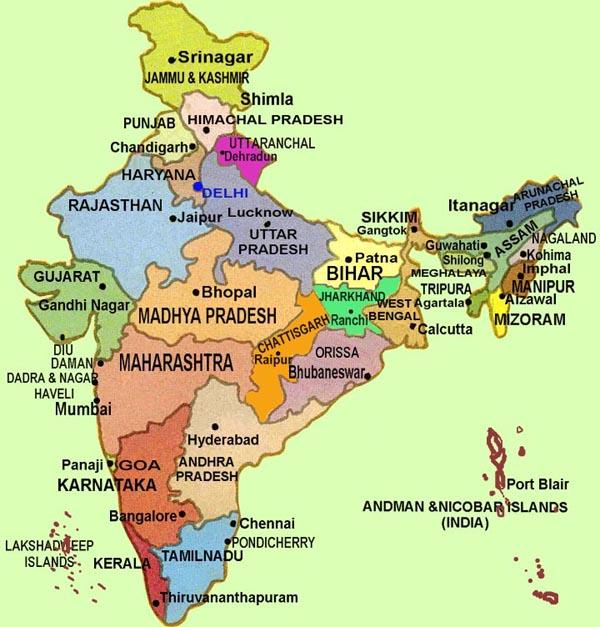
India, with a population of slightly more than one billion people living in 25 states, is the second most populous country in the world, behind China. At a growth rate of 1.7% per annum, the country's population is projected to grow to 1.15 billion by the year 2010. India has a land area of 2,973,190 square kilometers, or slightly more than one third that of the United States, and is bordered by Pakistan to the west, Bhutan, China, and Nepal to the north, Bangladesh to the east, and the Indian Ocean to the south. India consists of 35 administrative divisions, including 28 states and 7 union territories; these are shown in Figure 1. The capital city, New Delhi, is located in the north-central part of the country and has a population (including the neighboring city of Delhi) of about 11.7 million. India's currency, the rupee (Rs), has an exchange rate (as of December 2002) of about 48.23 Rs per U.S. dollar.
Growth in India's gross domestic product (GDP) hovered around 7.0% from 1994-1997. Real GDP growth slowed in 1998 to 4.6%, but rebounded to 6.8% in 1999 and 6.5% in 2000. Gross domestic product for fiscal year 2001 is estimated to grow at 6.3%. Taking away population growth, this translates to a real growth rate of about 4.4% -- still large enough to make India one of the fastest growing economies in the world. However, India remains unable to attract a large amount of Foreign Direct Investment into its economy.
Various agencies within Indian government oversee energy policy in India and include the Ministry of Petroleum and Natural Gas, the Ministry of Coal, the Ministry of Non-Conventional Energy Sources, the Ministry of Environment and Forests, the Department of Atomic Energy, and the Ministry of Power. Within the Ministry of Power, the Central Electricity Regulatory Commission works closely with the State Electricity Boards and utilities in power generation, transmission, and distribution of electricity. Under the Department of Atomic Energy, the Atomic Energy Commission was established as the policy-making body for the development and utilization of atomic energy for peaceful purposes.
Under the Ministry of Petroleum and Natural Gas are the Directorate General of Hydrocarbons (DGH) and the Oil Coordination Committee. The DGH was set up in 1993 to oversee petroleum exploration programs, develop plans for the state-owned oil enterprises and private companies, and oversee efficient utilization of gas fields. The Oil Coordination Committee oversees, plans, regulates, and advises on the downstream sector. The Gas Authority of India Limited (GAIL) is responsible for transportation and marketing of natural gas. State-owned companies like the Oil and Natural Gas Corporation (ONGC) and Oil India Limited (OIL), which manage exploration and production activities, and the Indian Oil Corporation (IOC), which secures oil from abroad, also help shape the direction of energy policy.
The ministries that oversee transportation of fuels are also important. The Ministry of Shipping Transport is responsible for the importation of energy aboard ships of the state-owned Shipping Corporation of India. The Parliamentary Committee on Energy and the Energy Policy Division of the Planning Commission also are involved in steering policies concerning energy.
Lack of a comprehensive energy policy is a barrier to foreign investment in long-term energy projects in India. To address the absence of a policy, the government released in early 2000 Hydrocarbon Vision 2025, a study whose recommendations may become official policy. The study suggests, among other things, that India revise foreign ownership regulations for refinery operations to allow 100% foreign ownership. The study calls for elimination of government subsidies for petroleum over the course of the next 3-5 years. The government is being encouraged to allow domestic gas prices to float to international levels which would affect the 25% of the gas market that is protected by government price controls. Furthermore, the study set down a goal to supply 90% of India’s petroleum and diesel needs from domestic sources.
While the study contains some positive news for foreign investors, it also effectively halts foreign companies from participating in the petroleum retail market. The right to market transportation fuels -– aviation fuel, diesel, and motor fuels -– the study states, should remain limited to state-owned firms.
With respect to energy, India is a net importer of energy and consumes roughly 3% of the world's total energy. India has large indigenous coal reserves and is the third largest coal-producing country in the world behind China and the United States. Nearly 30% of India's energy needs are met by oil, and more than 60% of that oil is imported. Natural gas supplies a mere 6% of India's energy needs, but this percentage is expected to increase in the future.
In the electric power sector, coal supplies more than half of India's electric power needs. About one-fifth of India’s electric generating needs are met by hydroelectric power. Additionally, India operates 14 nuclear reactor units that have a combined generating capacity of 2,720 megawatts (MWe).
India consumes 12.18 quadrillion Btu (Quads) of energy, or roughly three percent of the world's total energy. The 1999 estimated fuel share of energy consumption in India is comprised of coal (55.0%), followed by oil (30.5%), natural gas (7.0%), renewables and traditional fuels (eg., wood) (3.60%), hydroelectric power (2.8%), and nuclear (1.1%). Despite increases in energy use, consumption on a per capita basis is still low in relation to other countries. In 1997, per capita consumption was 12.4 million British thermal units (Btu) against a world average of 64.8 million Btu and a U.S. average of 351.9 million Btu.
Continued economic development and population growth are driving energy demand faster than India can produce it. India’s electricity sector currently faces capacity problems, poor reliability, and frequent blackouts. Moreover, industry cites power supply as one of the biggest limitations on progress. The shortfall means the country will increasingly have to look to foreign sources of energy supplies, transported mostly via ship and pipeline. One government estimate projects 8-10% annual growth in energy demand over the next 15 years if the economy grows as expected in the 7-8% per year range.
An historical summary of India's Total Primary Energy Production (TPEP) and Consumption (TPEC) is shown in Table 1.
| 1990 | 1991 | 1992 | 1993 | 1994 | 1995 | 1996 | 1997 | 1998 | 1999 | 2000 | |
| TPEP | 6.57 | 6.86 | 7.17 | 7.37 | 7.63 | 9.01 | 8.83 | 9.05 | 9.03 | 9.18 | 9.48 |
| TPEC | 7.78 | 8.06 | 8.71 | 9.10 | 9.59 | 11.10 | 11.25 | 11.55 | 11.78 | 12.12 | 12.67 |
Oil
Production and
Consumption
Nearly 30% of India’s energy comes from oil. In 1999,
the country consumed approximately 1.93 million barrels per day (b/d).
Given strong growth in oil demand, oil consumption is projected to climb to
3.1 million b/d by 2010.
Domestic production of oil in 1999 was 747,000 b/d versus imports of 1.18 million b/d. Oil reserves are estimated at 4.7 billion barrels. India draws most of its oil from the Bombay High, Upper Assam, Cambay, Krishna-Godavari, and Cauvery basins. The Bombay High Field, India’s largest producing field, generated 250,000 b/d in 1998 and 210,000 b/d in 1999.
An historical summary of petroleum production and consumption in India is shown in Table 2.
| 1990 | 1991 | 1992 | 1993 | 1994 | 1995 | 1996 | 1997 | 1998 | 1999 | 2000 | |
| Production (total)* | 674 | 629 | 593 | 568 | 639 | 754 | 735 | 764 | 755 | 747 | 740 |
| Production (Crude Oil only) | 660 | 615 | 561 | 534 | 590 | 703 | 651 | 675 | 661 | 653 | 646 |
| Consumption | 1,168 | 1,190 | 1,275 | 1,311 | 1,413 | 1,575 | 1,681 | 1,765 | 1,844 | 1,959 | 1,990 |
The Ministry of Petroleum and Natural Gas (MoPNG) oversees the entire chain of the oil industry: exploration and production of crude oil and natural gas; refining, distribution, and marketing of petroleum products and natural gas; and exports and imports of crude oil and petroleum products.
The Oil and Natural Gas Corporation Limited (ONGC) and Oil India Limited (OIL) fall under the purview of the MoPNG and are responsible for exploration and production activities in India. The Gas Authority of India Limited (GAIL) is responsible for transportation and marketing of natural gas in India.
An increasing percentage of India’s oil production is coming from offshore sources since oil and gas were discovered off the west coast in the Arabian Sea in 1974. By 1979-80, India was getting one-third of its oil from offshore; by 1982-83 one-half; and over two-thirds by 1986-87. Offshore production levels have since leveled off at slightly less than two-thirds of overall production.
India suffers from low drilling recovery rates. Recovery rates in Indian fields average only about 30%, well below the world average. The government hopes one of the benefits to opening up the energy industry to foreign companies will be access to better technology which will help improve recovery rates.
The potential for discoveries offshore, particularly in deep water, is greater and garners much of India’s attention. Exploration has taken place in only one-quarter of India’s 26 sedimentary basins. Offshore basins cover approximately 380,000 square kilometers, while onshore basins cover 1.34 million square kilometers. It is estimated that these basins may contain as much as 30 billion tons of hydrocarbon reserves.
The Indian government is encouraging increased production and exploration of petroleum to reduce its dependence on imported oil. The cost of oil imports in 1998 was $7.6 billion, representing nearly one-fifth of total imports. It is estimated that by 2010 almost three-quarters of India’s oil and gas needs will be met by imports.
The government forecasts that India will deplete its oil reserves by 2012 with present consumption and production patterns. It is hoped that increased exploration will extend India's reserves. Although no major discoveries have been made in recent years, Western Rajasthan has shown promise. However, some experts take the position that India’s easy-to-reach reserves have already been tapped.
Wary of a growing reliance on imported oil, the government announced the New Exploration Licensing Policy (NELP) in 1997, which opened the door to involvement by foreign energy companies. Prior to this policy, exploration was strictly limited to Indian enterprises. Foreign firms were initially hesitant to bid on oil exploration rights, and as a result no bids were received from foreign energy companies in 1999. However, by early 2000 India had awarded 25 oil exploration blocks. The largest contract went to Reliance Industries of India, which together with Niko Resources of Canada, won 12 oil exploration blocks. ONGC won eight blocks, three of which were in partnership with other public-sector Indian companies. Cairn Energy of the UK, Russia's Gazprom, Mosbacher Energy of the U.S.A., and Geopetrol of France all teamed with Indian firms to win single blocks. TotalFinaElf did not bid on any oil exploration blocks, but has expressed interest in acquiring stakes in some blocks operated by state-owned companies, particularly in the Bombay High area. A second set of exploratory blocks currently is up for auction; bids were due by March 31, 2001.
Additionally, the government is encouraging Indian energy companies to get involved in exploration and production projects in other Asian countries to make them more competitive in the international arena and develop their technical prowess. Indian companies have become active in other oil projects in Asia, Sudan, Australia, and Russia. In early 1999, IOC and ONGC formed a strategic alliance designed to improve the international competitiveness of both firms. IOC, involved in refining and distribution, and ONGC, an oil producer, swapped 10% of their respective shares. Unfortunately, the transaction may have weakened both companies’ ability to invest in exploration and production. Some analysts believe the deal amounted to a $1.2 billion transfer to the government.
Refining and Petrochemicals
India is
becoming a major global market for petroleum products. Consumption of petroleum
products rose from 57 million tons in 1991-1992 to 107 million tons in
2000. Forecasts for 2005 put market volume at 163.8 million tons. The
India Hydrocarbon Vision 2025 report estimates future refinery demand at
368 million tons by 2025.
Consumption of middle distillates makes up 60% of the petroleum market. About one-fifth goes to each heavy ends and light distillates. Given the growth and dominance of the transportation sector, high-speed diesel oil accounts for the largest share of large petroleum products. Better than 40% of consumption is of high-speed diesel oil followed by kerosene and furnace oil. India imports all types of petroleum products except for High Aromatic Naphtha (HAN).
An historical summary of refined petroleum product output in India is shown in Table 3.
| Fuel Type | Production Rate | |||||||||
| 1990 | 1991 | 1992 | 1993 | 1994 | 1995 | 1996 | 1997 | 1998 | 1999 | |
| Motor Gasoline | 83 | 82 | 80 | 83 | 96 | 104 | 110 | 114 | 123 | 142 |
| Jet Fuel | 39 | 36 | 36 | 37 | 43 | 46 | 46 | 47 | 44 | 50 |
| Kerosene | 116 | 115 | 114 | 114 | 110 | 112 | 132 | 135 | 134 | 119 |
| Distillate Fuel Oil | 382 | 380 | 373 | 373 | 402 | 450 | 479 | 477 | 511 | 713 |
| Residual Fuel Oil | 185 | 183 | 207 | 205 | 198 | 191 | 204 | 214 | 292 | 227 |
| Liquefied Petroleum Gases | 40 | 68 | 81 | 87 | 89 | 105 | 109 | 111 | 55 | 75 |
| Lubricants | 11 | 10 | 8 | 10 | 10 | 12 | 12 | 11 | 12 | 13 |
| Other * | 190 | 223 | 228 | 221 | 248 | 229 | 240 | 287 | 289 | 304 |
| Total | 1,047 | 1,098 | 1,128 | 1,129 | 1,197 | 1,249 | 1,331 | 1,396 | 1,461 | 1,643 |
| Refinery Fuel and Losses | 40 | 42 | 43 | 43 | 55 | 48 | 51 | 54 | 56 | 63 |
India has 17 refineries throughout the country; 15 are state-owned, one is jointly-owned and one is privately-owned. A summary of these refineries is shown in Table 4.
| Company | Location | Capacity (b/d) |
| Indian Oil Corporation Ltd. (IOC) | Guwahati | 20,000 |
| Barauni | 84,000 | |
| Koyali | 251,000 | |
| Haldia | 75,000 | |
| Mathura | 150,000 | |
| Digboi | 13,000 | |
| Panipat | 120,000 | |
| Hindustan Petroleum Corp. Ltd. (HPCL) | Mumbai | 110,000 |
| Visakh | 90,000 | |
| Bharat Petroleum Corp. Ltd. (BPCL) | Mumbai | 138,000 |
| Madras Refineries Ltd. (MRL) | Chennai | 130,000 |
| Cochin Refineries Ltd. (CRL) | Cochin | 150,000 |
| Bongaigaon Refinery and Petrochemicals Ltd. (BRPL) | Bongaigaon | 47,000 |
| Crude Distillation Unit of MRL | Narimanam | 10,000 |
| Numaligarh Refineries Ltd. (NRL) | Numaligarh | 60,000 |
| Mangalore Refinery and Petrochemicals Ltd. (MRPL) | Mangalore | 195,000 |
| Reliance Petroleum Ltd. (RPL) | Jamnagar | 542,000 |
| Total | 2,185,000 | |
Refinery capacity has been unable to meet domestic consumption of refined petroleum products and so the country has had to rely partially on imports. This situation has improved with the completion of 970,000 b/d of additional refinery capacity between 1998-2000. Noteworthy is the completion of the 360,000 b/d refinery at Jamnagar in the summer of 1999 and a tripling of capacity at the Mangalore refinery to 180,000 b/d. Reliance Petroleum, owners of the Jamnagar refinery, plans to boost output to 540,000 b/d. Refinery capacity now stands at about 2.1 million b/d. This should be enough to make India self-sufficient in refining capacity, but operational problems have forced the country to import diesel fuel. Construction was scheduled to begin in February 2001 on the 120,000 b/d Essar unit. This unit is also located at Jamnagar.
Plans also exist for construction of over 2.2 million b/d of refinery capacity by 2004-06. The government is looking to several joint ventures to supply 860,000 b/d of the planned expansion with 540,000 b/d coming from public service companies. Some of the increased capacity will come from additions to existing refineries. Letters of intent have been issued for another 820,000 b/d by 2005. The price tag has been placed at $22 billion. Another estimate places the cost of making India self-sufficient over the next five years at $10.1 billion. According to Hydrocarbon Vision 2025, India will need to invest $57.54 billion over the next 25 years to meet its petroleum product needs.
Planned expansions to existing refinery operations in India are summarized in Table 5.
| Refinery | Location | Old Capacity (b/d) |
New Capacity (b/d) |
Status |
| Indian Oil Corporation Ltd. (IOC) | Baruni | 84,000 | 120,500 | Approved |
| Mathura | 150,000 | 160,000 | Approved | |
| Hindustan Petroleum Corp Ltd. (HPCL) | Visakh | 90,000 | 150,000 | Approved |
| Cochin Refineries Ltd. (CRL) | Cochin | 150,000 | 271,000 | Under Construction |
| Crude Distillation Unit of MRL | Baruni | 10,000 | 70,000 | Under Construction |
For India to meet its ambitious refinery expansion goals it will need help from multinationals and private Indian companies. The main focus of a liberalization program that began in the mid-nineties has been greater access to the refinery sector for private companies and a green light for joint ventures with state-run enterprises. One approach has been tax breaks such as granting plants completed by 2003 a five-year tax holiday. Regulatory reform has entered into the picture, allowing foreign firms that invest in excess of $400 million in refinery operations to sell refined products. The reaction by multinationals to these reform efforts has been less than enthusiastic. Despite the progress the industry has made on price deregulation and greater access to the market, barriers to entry remain as state-run firms still have power over the pipelines and distribution channels. To that end, Hydrocarbon Vision 2025 recommends a comprehensive, long-term refinery policy to attract more foreign participation, suggesting government increase the maximum level of foreign participation in oil refining from 49 to 74%. It calls on the government to adopt more of a hands-off policy toward the sector, and favors allowing refineries freedom in sourcing crude and utilizing more risk-management techniques such as commodities hedging.
Natural Gas
Natural gas now supplies about 7% of
India's energy. Consumption of natural gas rose from 628 billion cubic feet
(bcf) per year in 1995, to 752 bcf in 1999. Power generation, fertilizers,
and petrochemicals production are industries that have been turning to natural
gas as an energy feedstock. Natural gas will become a bigger part of the energy
picture for India, primarily as a way to reduce dependence on foreign oil.
Furthermore, the environmental benefits of its absence of sulfur dioxide and
reduced levels of carbon dioxide and nitrogen oxide are appealing to a country
increasingly struggling with environmental concerns. Currently, India’s natural
gas consumption is met entirely with domestic production. However, this scenario
is expected to change within a few years as India’s government has called for
the construction of gas-fired power plants in the country’s ninth Five-Year
Plan (1997-2002). These plants will be located along the coast to allow for
easier access to supply by LNG tankers.
An historical summary of natural gas production and consumption in India is shown in Table 6.
| 1990 | 1991 | 1992 | 1993 | 1994 | 1995 | 1996 | 1997 | 1998 | 1999 | 2000 | |
| Production | 0.40 | 0.45 | 0.48 | 0.53 | 0.59 | 0.63 | 0.70 | 0.72 | 0.76 | 0.75 | 0.79 |
| Consumption | 0.399 | 0.449 | 0.477 | 0.532 | 0.594 | 0.628 | 0.696 | 0.717 | 0.761 | 0.752 | 0.795 |
Demand for natural gas likely will outstrip the country’s ability to produce it. Natural gas demand is forecast to rise to 1.7 tcf/year by 2005, and 2.7 tcf/year by 2010. Estimates of India's future natural gas demand is shown in Table 7.
| Year | Forecasted Demand |
| 2001-2002 | 151 |
| 2006-2007 | 231 |
| 2011-2012 | 313 |
| 2024-2025 | 391 |
Since 1987-88 over 70% of the country’s gas has come from offshore fields. In 1997 73%, or 590.4 bcf of the 808.6 bcf produced in India, came from offshore sources. The area northwest of Mumbai in the Arabian Sea is India's major natural gas producing region. Bombay High, Heera, Panna, South Bassein, Neelam, Bombay L-II, and Bombay L-III fields are in this area, lying some 110-200 kilometers off the coast. The region is also rich in crude oil.
Off the east coast in the Bay of Bengal lies the Krishna-Godavari and Kaveri Basins which together account for less than five percent of India’s production of natural gas. The Krishna-Godavari Basin is home to the Ravva Field while the Kaveri Basin contains the PY-1, PY-3 and KH-3 fields. An area off the Andaman and Nicobar Islands, also in the Bay of Bengal, has shown promise for holding what could be the country’s largest reserves of coal bed methane (CBM).
India is investing heavily in pipelines and LNG infrastructure. It is also reducing flaring that accompanies petroleum production. In 1999, flaring of natural gas amounted to 86 bcf. Unclear regulations on LNG imports impede investment in the sector. A new bill before the Indian Parliament, the Petrocomm Regulatory Bill, would seek to increase the attractiveness of new projects by assigning exclusive rights to distribute gas in certain areas.
The country has plans to build 12 LNG terminals. If all the terminals are completed India will have importing capacity of 50 million metric tons per year (mmt/y) of LNG. The 12 locations are: Jamnagar, Dabej, Hazira, Pipavav, Trombay, Dabhol, Mangalore, Cochin, Ennore, Kakinada, Gopalpur, and Paradeep. A joint venture between several state-owned firms and Gaz de France will be the largest player in the LNG construction boom. Joining Gaz de France in forming Petronet are the Gas Authority of India, Ltd (a public sector enterprise), IOC, ONGC, and the National Thermal Power Corporation (NTPC). Petronet will build a LNG terminal at Dahej and one at Cochin. RasGas of Qatar will supply the terminals with LNG from the end of 2003. These two projects have been delayed while financial issues are finalized. The timetable is for financial closure by 2001. Other companies involved in LNG terminal projects include Enron, British Gas, NTPC, Tata Electric, TotalFinaElf, Shell, and Reliance Industries. Enron is looking to secure supplies for its Dabhol power plant. The company is talking with Qatar to supply 5 mmt/y of LNG valued at $4 billion by 2001. Reliance Industries is involved with terminals at Hazira and Janmagar which will be able to handle 5 mmt/y. British Gas is participating in the Pipavav terminal (2.65 mmt/y) with the LNG coming from Yemen. Shell is involved in the 2.5 mmt/y Hazira terminal for which Oman is scheduled to provide the natural gas. A group consisting of CMS Energy, Woodside Petroleum, Siemens, and Unocal formed to build a terminal at Ennore has delayed the project pending financial guarantees and a power purchase agreement.
Coal
Reserves, Mining, and
Washeries
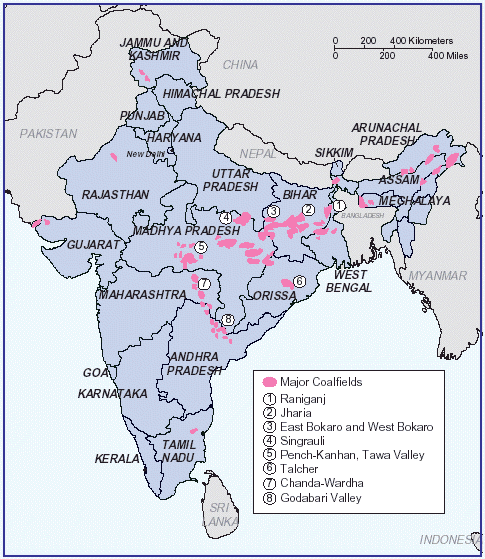
India has huge coal reserves, with at least
80 billion tons of proven recoverable reserves of anthracite and bituminous
coals, and at least another 2 billion tons of recoverable reserves of
lignite and sub-bituminous coal. India's coal reserves account for 8% of the
world's total.
India is the third leading coal producer in the world after China and the United States. As such, India is able to satisfy most of its country's coal demand through domestic production; the exception is its shortage of coking coal. Domestic production is concentrated in the Bihar, West Bengal, and Madhya Pradesh regions. A summary of India's coal reserves is shown in Table 8.
| Coal Type | Proven | Indicated | Inferred | Total |
| Coking prime coking medium coking blendable/semi-coking |
16,364 4,614 11,267 482 |
12,735 699 11,133 904 |
1,328 n/a 1,106 222 |
30,427 5,313 23,506 1,608 |
| Non-Coking | 66,032 | 76,765 | 38,369 | 181,167 |
| Total | 82,396 | 89,501 | 39,697 | 211,594 |
A map of India's coal reserves is shown in Figure 2.
Indian coal has a high ash content, in excess of 35%, and low calorific content. Due to the high content of ash, the government is looking to utilize advanced technologies to clean coal. The government has passed new regulations regarding the cleaning of coal; all coal shipped to new generating plants, environmentally sensitive areas, or distances in excess of 1,000 kilometers must be washed. The combined washing capacity of India's 21 washeries is about 41 million tons. Considerable investment opportunities are open for investment in build-own-operate (BOO) washery projects.
Coal India Limited (CIL) owns 17 of the washeries, and owns nearly all of the country's 390 coal mines. The exceptions are small, 'captive' mines that supply a particular power plant or factory. CIL's operations are characterized by low productivity levels, distribution problems, and market share losses to higher quality, less expensive coal from overseas. Productivity levels are only around 0.5 tons per man-shift.
On April 1, 2000, the pricing of coal became fully deregulated with the Colliery Control Order. This supersedes the Colliery Control Order (1945) of the Essential Commodities Act of 1955 by which the central government had been empowered to fix the prices of coal by grade and colliery.
The Ministry of Coal (MoC) has the overall responsibility of determining policies and strategies relating to exploration and development of coal and lignite reserves. The key functions of the MoC are exercised through CIL and its subsidiaries, and the Neyveli Lignite Corporation Limited (NLC). Both the CIL and the NLC are public sector enterprises. CIL produces more than 85% of India's coal and is the largest coal producing company in the world.
The Indian government has done little recently to encourage private sector involvement in its growing coal industry. The legal barrier to commercial coal trading from captive mines has precluded private investment into coal mining projects for power production in India. As such, long-awaited amendments to the Coal Mines Nationalisation Act are being pursued that will allow coal mining by private investors for open trading. However, investors have found that only unattractive coal blocks, where the state-controlled CIL did not want to invest, have been offered.
In early April 2001, the Confederation of Indian Industry (CII) urged the government of India to expedite the amendment of the Coal Mines Nationalisation Act, stating that it will provide a level playing field to both private and public sector companies. CII is advocating not only the liberalization of guidelines for allocation of coal blocks to private sector, but also the opening of virgin block to both private and public sector.
Production and Consumption
India depends
on coal for more than half of its total energy needs. Nearly three quarters of
the country's electricity and 63% of commercial energy comes from coal.
Projected consumption is expected to climb to 444 million short tons by
2001 and 492 million short tons by 2010.
Despite India's wealth in coal reserves, only about 3% is coking coal so India's steel industry must import coking coal, mostly from Australia and New Zealand, to meet about 25% of its annual needs.
An historical summary of coal production and consumption in India is shown in Table 9.
| 1990 | 1991 | 1992 | 1993 | 1994 | 1995 | 1996 | 1997 | 1998 | 1999 | 2000 | |
| Production Anthracite Bituminous Lignite |
233.39 n/a 217.84 15.55 |
252.74 n/a 235.13 17.60 |
270.25 n/a 252.82 17.43 |
281.23 n/a 262.91 18.32 |
279.69 n/a 258.37 21.32 |
297.77 n/a 273.36 24.41 |
314.85 n/a 290.01 24.85 |
326.06 n/a 300.66 25.41 |
322.17 n/a 296.63 25.54 |
327.51 n/a 302.44 26.07 |
344.96 n/a 317.36 27.60 |
| Consumption | 241.80 | 252.17 | 273.67 | 286.12 | 291.40 | 311.86 | 332.50 | 342.61 | 339.78 | 345.36 | 369.22 |
The outlook is improving for India's nuclear power industry. The country’s nuclear plants have been running at an average capacity factor of around 80%, and reactor outages have shortened. The quality of fuel supplies has gone up and delivery times have improved. In 1999, NPCIL declared its first dividend, but the nuclear industry still is heavily reliant on government funding. Government spending on new projects for the current five-year plan (1997-2002), at $193.5 million, is five times the level during the previous five-year plan. By mid-2001, two more reactors are scheduled to go critical. Construction is progressing on the third and fourth reactors at Tarapur, both 500-MWe units. Construction is scheduled for Kaiga-3 and 4 in Karnataka state. Four 500-MWe reactors are being planned for Rawatbhata. Tarapur 3 and 4 will be the first of the country’s reactors to use Indian-developed design and technology.
India’s uranium reserves stand at about 34,000 tons, of which only 44% are economically exploitable. Table 10 shows the operational nuclear power plants in India.
| Power Plant | City or District | State | Total Capacity (MWe) |
| Kaiga | Kaiga | Karnataka | 440 |
| Madras | Madras | Tamil Nadu | 470 |
| Narora | Bulandshar District | Uttar Pradesh | 470 |
| Kakrapar | Surat District | Gujarat | 440 |
| Rajasthan | Via Kota | Rajasthan | 880 |
India is trying to encourage greater foreign participation in its nuclear power program, but its failure to sign the Comprehensive Test Ban Treaty (CTBT) stands in the way of attracting Western firms and Western technical support. So far, Russia has been the most active, having been awarded the construction contract for two 1,000-MWe reactors at Kudankulam in southern India. Kudankulam I is scheduled to begin service in 2006 followed by Kudankulam II in 2008.
India is also working on a fast breeder program. In 1997 it began operating a 13 MWe unit at the Indian Gandhi Center for Atomic Research in Kalpakkam. It plans to build a 500-MWe prototype fast breeder there in the near future.
Hydroelectric and Other Renewable
Energy
Hydroelectric Power
India's
largest and longest river is the Ganges, with its major tributary the Yamuna,
which flows southeastward along the foothills of the Himalaya mountain range
until it enters Bangladesh and then turns southward to empty into the Bay of
Bengal. Other major Indian rivers include the Narmada, which flows westward
through central India into the Arabian Sea, and three eastward-flowing rivers,
the Godavari, the Krishna, and the Cauvery, which flow through southern India
into the Bay of Bengal. Besides these, there are two other major rivers which
pass through India -- the Indus, which rises in Tibet and flows northwestward
through the northern state of Jammu & Kashmir before entering Pakistan, and
the Brahmaputra, which also rises in Tibet and flows southwestard through the
eastern Indian states of Arunachal Pradesh and Assam before entering Bangladesh
and joining the Ganges. A map of India's rivers is shown in Figure 3.
India has vast hydroelectric potential. Estimates place hydroelectric potential at 86,000 MWe, only about one-quarter, or 22,000 MWe, of which has been utilized. About one-fifth of India's total electricity generation comes from hydroelectric power plants.
The Ministry of Power announced plans in early 2000 to build the world’s largest hydroelectric plant. The plant, to be built on the Brahmaputra River by the National Hydroelectric Power Corporation (NHPC), will have a capacity of 21,000 MWe and cost $23 billion. Due to become fully operational in 2012, the first of six phases will come online in 2008 with 600 MWe of generating capacity.
A summary of India's largest hydroelectric power plants is shown in Table 11.
| Power Plant | State | Total Capacity (MWe) |
| Dehar | Rajasthan | 990 |
| Sharavathi | Karnataka | 891 |
| Koyna | Maharashtra | 880 |
| Kalinadi I | Karnataka | 825 |
| Nagarjun Sugar | Andhra Pradesh | 815 |
| Idduki | Kerala | 780 |
| Srisailam Right Bank | Andhra Pradesh | 770 |
| Bhakra-Nangal | Rajasthan | 710 |
| Salal | Jammu & Kashmir | 690 |
| Kundah | Tamil Nadu | 555 |
Alternative energy sources such as wind, solar photovoltaic (PV) technologies, and biomass have a future in India. By 2012, India wants to see 10% of all additional electric capacity come from renewable energy sources. The Indian Renewable Energy Development Agency, which is a part of the Ministry of Non-Conventional Energy Sources, oversees development of these energy sources.
Solar Power
Most parts of India get 300
days of sunshine a year. There is a large market for PV technology and progress
has been made in the deployment of small, stand-alone PV systems. A total of
58 MWe in capacity has been installed through 750,000 systems, including
solar lanterns, home lighting systems, street lighting systems, water pumping
systems, and 1.1 MWe in stand-alone power plants.
Wind Power
India has abundant wind
resources to harness for power generation. Strong seasonal winds blow across the
Indian subcontinent April through September. India ranks fifth in the world in
the number of wind power installations; wind power installed capacity as of June
2000 was 1,175 MWe. The Ministry of Non-Conventional Energy Sources has
identified 192 potential sites for wind stations with a total estimated
potential of 20,000 MWe. The states of Gujarat, Andhra Pradesh, Tamil Nadu,
Karnataka, Kerala, Madhya Pradesh, and Maharashtra have the highest potential.
Market growth in the wind sector has slowed in recent years because of lower
expectations of wind resources in some areas and poor plant design.
Geothermal Power
Geothermal power has very
limited market potential despite 2,000-10,000 MWe of resources. The
Geological Survey of India (GSI) has developed an atlas identifying more than
300 potential sites. Geothermal heat has potential for small-scale power
generation, crop drying, cooking, space heating, and for greenhouse use.
Biomass
The Ministry of Non-Conventional
Energy Sources estimates India’s energy potential from biomass at nearly
20,000 MWe, with 16,000 MWe from biomass and 3,500 MWe from
co-generation plants using bagasse from sugar mills. Thirty co-generation
projects capable of generating 183 MWe and ten biomass projects capable of
generating 39 MWe have been commissioned.
Table 12 shows estimates of potential power generation from renewable sources in India.
| Source | Approx. Potential |
| Biomass energy | 17,000 |
| Solar energy | 20,000 |
| Wind energy | 20,000 |
| Small hydropower | 10,000 |
| Ocean energy | 50,000 |
There are plans to construct pipelines to import gas into India from Iran, Oman, and Bangladesh. Of these schemes, the Iran-India pipeline has made the most progress, but the $2 billion link still has to overcome the difficulty of winning Pakistani approval for the pipeline to pass through Pakistani waters. The Oman-India deal is also under pressure because of the $7 billion price tag, a possible shortage of reserves, and the difficulties of building a submarine pipeline in such deep waters; the pipeline would lay as deep as 3.5 kilometers under the sea. Unocal wants to invest $1.2 billion in a Bangladesh-India submarine pipeline that would run from Bangladesh to the Vishakapatnam-Kakinada coast in Andhra Pradesh, India, and connect to an above-ground pipeline that would extend to Delhi via Calcutta. The company also has plans to run a $2 billion pipeline from Myanmar through Bangladesh to Haldia in India. This pipeline would also supply Bangladesh with gas from the Indian field of Tripura.
The Gas Authority of India Ltd. (GAIL), a public sector enterprise in India, is the largest gas transmission and marketing company in the country. GAIL owns and operates over 4,000 kilometers of pipeline, concentrated principally in northwestern India, but spread over all the regions of the country. GAIL handles approximately 95% of the total amount of natural gas transmitted by pipeline in India, and owns the largest pipeline network in the country, the cross-country 2,300 kilometers Hazira-Bijaipur-Jagdishpur (HBJ) pipeline. GAIL is currently constructing the world’s longest (1,250 kilometers) exclusive LPG pipeline from Gujarat in western India to Loni near New Delhi in north India.
Electricity Grid
Electricity in India
reaches about 80% of the country. The electric power network in India consists
of transmission lines of 800 kilovolts (kV), 400 kV, 220 kV, and
132 kV; step-down substations; and medium and low voltage distribution
networks.
India has plans to create a unified power grid to serve the entire country. The government has established a state-run company, Powergrid, as the nation’s transmission company for that purpose. Only two of the country’s five regional grids are connected. A unified power grid will improve efficiency through power sharing. Parts of India are already connected to Nepal and Bhutan, with talks underway to connect India, Pakistan, Nepal, Bhutan, Bangladesh, and the Maldives through a South Asian grid. The Indian government will set up a regulatory apparatus to set tariffs and foster competition.
ElectricityAt the state level, State Electricity Boards (SEBs) constituted by the state governments, are responsible for ensuring generation, transmission, and distribution of electricity in India. To accomplish this, the SEBs are required to coordinate with the generating companies, if any, operating in the state and with the central government or any other board or agency that has control over the power system.
The Central Electricity Regulatory Commission (CERC) was set up under the Electricity Regulatory Commissions Act of 1998 as an independent statutory body with quasi-judicial powers. The CERC regulates tariff-related matters and interstate bulk power sales; aids and advises the central government on the formulation of tariff policy; frames the guidelines pertaining to tariffs; and promotes competition and efficiency in the electricity sector.
Currently, the bankrupt conditions of the SEBs are an impediment to providing adequate supplies of power to India’s citizens and businesses. The SEBs are currently experiencing financial losses on the order of $5 billion a year, or 1.2% of GDP. Their financial stresses mean erratic power supplies and high costs for businesses that cannot afford power supply interruptions. In fact, the country faces an electricity shortage conservatively estimated at 11%, and as high as 18% during peak demand. To help alleviate this problem in the short run, many corporations have established their own power generation capacity to ensure reliability of power supply. Longer-term fixes proposed by the Indian government include financial aid to states that show reform measures such as the metering of all customers.
Generation and Consumption
Despite urgent
claims to substantially increase power generation capacity, the record has
fallen short in India. Independent power producers that were supposed to be a
key player in enhancing power generation capacity in India are only producing
2.7% of the capacity they were supposed to produce in 2000. Further, the
Ministry of Power estimates total energy losses at 21% (though unofficial
figures place it much higher) and power outages are frequent occurrences. With
the exception of 1998, electricity generation in India has been increasing by
slightly less than 10% per year over the past decade. A similar trend is evident
for electricity consumption. An historical summary of electricity generation and
consumption in India is shown in Table 13.
| 1990 | 1991 | 1992 | 1993 | 1994 | 1995 | 1996 | 1997 | 1998 | 1999 | 2000 | |
| Net Generation hydroelectric nuclear geo/solar/wind/biomass conventional thermal |
275.5 70.9 5.6 0.0 198.9 |
300.3 72.0 5.2 0.0 223.1 |
315.9 69.2 6.0 0.0 240.7 |
339.3 69.8 5.9 0.1 263.6 |
366.1 81.9 4.7 0.2 279.3 |
395.8 72.0 6.5 0.1 317.2 |
412.7 68.4 7.4 0.8 336.1 |
441.2 74.0 10.5 0.9 355.8 |
424.3 75.5 10.6 1.0 337.2 |
454.2 80.8 11.5 1.0 361.0 |
547.1 75.8 14.1 1.0 456.3 |
| Net Consumption | 257.1 | 280.6 | 295.1 | 316.9 | 341.9 | 369.7 | 385.4 | 411.7 | 395.9 | 423.4 | 509.9 |
| Imports | 1.0 | 1.4 | 1.4 | 1.4 | 1.6 | 1.7 | 1.7 | 1.6 | 1.5 | 1.4 | 1.4 |
| Exports | 0.1 | 0.1 | 0.2 | 0.1 | 0.1 | 0.1 | 0.1 | 0.1 | 0.2 | 0.3 | 0.3 |
Installed Capacity
Installed electricity
capacity in India was 103,445 MWe in 1999. Seventy-five percent of India’s
electricity comes from thermal power plants, 22% comes from hydroelectric power,
2% from nuclear power, and 1% from renewables. An historical summary of
installed electricity generating capacity in India is shown in
Table 14.
| 1990 | 1991 | 1992 | 1993 | 1994 | 1995 | 1996 | 1997 | 1998 | 1999 | 2000 | |
| Hydroelectric | 18.31 | 18.76 | 19.20 | 19.58 | 20.38 | 20.84 | 20.99 | 21.10 | 21.89 | 22.44 | 24.50 |
| Nuclear | 1.57 | 1.57 | 1.79 | 2.01 | 2.23 | 2.23 | 2.23 | 2.23 | 2.23 | 2.23 | 2.23 |
| Geothermal/Solar/ Wind/Biomass |
0.02 | 0.03 | 0.03 | 0.04 | 0.05 | 0.12 | 0.55 | 0.82 | 0.93 | 1.02 | 1.08 |
| Conventional Thermal | 51.86 | 54.35 | 57.35 | 60.75 | 65.04 | 69.19 | 71.89 | 73.40 | 75.19 | 77.77 | 80.35 |
| Total Capacity | 71.75 | 74.70 | 78.37 | 82.38 | 87.48 | 92.38 | 95.66 | 97.55 | 100.23 | 103.45 | 108.15 |
Industry Overview
The government is
targeting large investments in new power plants to increase generating capacity.
Under the current five-year plan which runs from 1997-2002, the government wants
to add an additional 47,000 MWe of capacity. A summary of large power
projects presently under construction is shown in Table 15.
| Power Plant | Total Capacity (MWe) |
Projected Completion Date |
Fuel | Location |
| Kameng | 600 | n/a | Hydro | Arunachal Pradesh |
| Panipat Ext 1 | 210 | n/a | Coal | Haryana |
| Baspa Ii | 300 | 2001 | Hydro | Himachal Pradesh |
| Kol Dam (Parbati) I 1-4 | 800 | n/a | Hydro | Himachal Pradesh |
| Nathpa Jhakri 1-6 | 1,530 | 2003 | Hydro | Himachal Pradesh |
| Korba East Ii 1 & 2 | 500 | 2003 | Coal | Madhya Pradesh |
| Dabhol 2 GT 1 & 2 | 500 | 2001 | Gas | Maharashtra |
| Dabhol 3 GT 1 & 2 | 500 | 2001 | Gas | Maharashtra |
| Dabhol 2 Sc 1 | 300 | 2001 | Waste Heat | Maharashtra |
| Dabhol 3 Sc 1 | 300 | 2001 | Waste Heat | Maharashtra |
| Bhatinda Refinery | 500 | n/a | Oil | Punjab |
| North Madras 3 No 1 & 2 | 526 | 2000 | Coal | Tamil Nadu |
| Pillaiperumalnallur | 330 | 2002 | Naphtha | Tamil Nadu |
| Bakreshwar 1-3 | 630 | 2001 | Coal | West Bengal |
| Balagarh 1 & 2 | 500 | 2002 | Coal | West Bengal |
Plans called for a further 111,500 MWe electricity generating capacity to come online by 2007. Such a sharp increase in capacity may prove too optimistic unless the government can come up with an overall energy policy that encourages greater cooperation between energy sectors, which will in turn draw investment capital from overseas. The country’s nine state electricity boards are financially ill-equipped to fund plant construction by themselves. Price controls that force utilities to sell electricity below cost, especially to farmers, contribute to their bleak financial picture. Huge losses through transmission and distribution of electricity are part of the problem. Electricity theft (usually referred to as "non-technical losses") is widespread. Efforts to improve efficiency and the pricing of electricity are receiving increased government attention. Only half of India’s generating capacity is utilized.
The Indian government is promoting the building of large, so-called mega projects. These include large-scale thermal projects with a capacity in excess of 1,000 MWe or hydroelectric plants with capacities of at least 500 MWe. Such projects will qualify for exemption from customs and countervailing duties. The decision has angered smaller players in power generation who are not eligible for the exemptions.
Progress is slow on these projects. Of the mega projects, construction has begun on only one: Dabhol. The need for financial guarantees, the capital crunch at near-bankrupt State Electricity Boards, and U.S. sanctions stemming from Indian nuclear tests in May 1998 have impeded progress. These sanctions prohibit new Export-Import Bank loans for products destined for India. U.S. exports constitute a 70-80% share of the power plant equipment market in India and three-quarters of these exports are backed by Export-Import Bank loans.
Foreign investors have been disappointed by the slow pace of project development and some have backed out. In December 1999, Cogentrix Energy decided to cancel its participation in a project to build the 1,000 MWe Mangalore coal-fired plant due to bureaucratic delays and lawsuits by public interest groups. Daewoo Power of South Korea and ABB withdrew from a 1,400 MWe power plant in Madhya Pradesh in August 2000. Similarly, in July 2000, Electricité de France (EDF) withdrew from construction of a plant in Maharashtra. Enron remains involved in the Dabhol project and wants to expand its involvement in developing other generating projects in India.
A summary of India's largest thermal-electric power plants, by fuel type, is shown in Table 16.
| Power Station | Capacity (MWe) |
Fuel | Location |
| Coal-fueled Power Plants | |||
| Korba West | 2,100 | coal | Madhya Pradesh |
| Ramagundam | 2,100 | coal | Andhra Pradesh |
| Neyveli | 2,070 | coal | Tamil Nadu |
| Singrauli | 2,050 | coal | Uttar Pradesh |
| Chandrapur | 1,900 | coal | Maharashtra |
| Vindhyachal | 1,760 | coal | Madhya Pradesh |
| Anpara | 1,630 | coal | Uttar Pradesh |
| Farakka | 1,630 | coal | West Bengal |
| Obra | 1,550 | coal | Uttar Pradesh |
| Talcher | 1,470 | coal | Orissa |
| Power Station | Capacity (MWe) |
Fuel | Location |
| Gas-fueled Power Plants | |||
| Uran | 672 | gas | Maharashtra |
| Trombay | 625 | gas | Maharashtra |
| Dadri | 524 | gas | Uttar Pradesh |
| Paguthan | 470 | gas | Gujarat |
| Auraiya | 448 | gas | Uttar Pradesh |
| Gandhar | 393 | gas | Gujarat |
| Hazira Essar | 350 | gas | Gujarat |
| Baroda Gipcl | 312 | gas | Gujarat |
| Anta | 264 | gas | Rajasthan |
| Kayamkulam | 230 | gas | Kerala |
| Power Station | Capacity (MWe) |
Fuel | Location |
| Oil- and Naphtha-fueled Power Plants | |||
| Dabhol | 453 | naphtha | Maharashtra |
| Kawas | 424 | naphtha | Gujarat |
| Chennai Vasavi | 206 | oil | Tamal Nadu |
| South Bassein | 152 | oil | Maharashtra |
| Pampore | 140 | oil | Jammu & Kashmir |
| Jamnagar Ril | 132 | naphtha | Gujarat |
| Yelahanka | 131 | oil | Karnataka |
| Basin Ridge | 124 | naphtha | Tamil Nadu |
| Brahmapuram | 110 | oil | Kerala |
| Maharashtra Cracker | 79 | oil | Maharashtra |
Air Pollution
India faces environmental
problems on several fronts. Economic development and a rapidly growing
population that has taken the country from 300 million people in 1947 to
over one billion people today is putting a strain on the environment,
infrastructure, and the country’s natural resources. Industrial pollution, soil
erosion, deforestation, rapid industrialization, urbanization, and land
degradation are all worsening problems.
The government agency responsible for environmental affairs is the Ministry of Environment and Forests (MoEF). Coping with India’s industrial pollution is perhaps the agency’s top priority. MoEF recognizes the need to strike a balance between development and protecting the environment in administering and enforcing the country’s environmental laws and policies. The government heightened the Ministry’s powers with the passage of the 1986 Environment Protection Act. This act built on the 42nd amendment to India's constitution in 1976 that gave the government the right to step in and protect public health, forests, and wildlife. This amendment however had little power as it contained a clause that stated it was not enforceable by any court. India is the first country in the world to pass an amendment to its constitution ostensibly protecting the environment.
India’s environmental problems are exacerbated by its heavy reliance on coal for power generation. Coal supplies more than half of the country’s energy needs and is used for nearly three-quarters of electricity generation. While India is fortunate to have abundant reserves of coal to power economic development, the burning of this resource, especially given the high ash content of India’s coal, has come at a cost in terms of heightened public risk and environmental degradation. Reliance on coal as the major energy source has led to a nine-fold jump in carbon emissions over the past forty years. The government estimates the cost of environmental degradation has been running at 4.5% of GDP in recent years.
The low energy efficiency of power plants that burn coal is a contributing factor. India's coal plants are old and are not outfitted with the most modern pollution controls. Given the shortage of generating capacity and scarcity of public funds, these old coal-fired plants will remain in operation for some time. Power plant modernization to improve the plant load factor, improvements in sub-transmission and distribution to cut distribution losses, and new legislation to encourage end user energy conservation were all mentioned as part of the energy efficiency effort.
The government has taken steps to address its environmental problems. As of now the use of washed coal is required for all power plants. Another such measure is new, tougher regulations on auto emissions. Vehicle emissions are responsible for 70% of the country’s air pollution. The major problem with government efforts to safeguard the environment has been enforcement at the local level, not with a lack of laws.
Air pollution from vehicle exhaust and industry is a worsening problem for India. Exhaust from vehicles has increased eight-fold over levels of twenty years ago; industrial pollution has risen four times over the same period. The economy has grown two and a half times over the past two decades but pollution control and civil services have not kept pace.
Air quality is worst in the big cities. New Delhi is on the World Health Organization's list of top ten most polluted cities. Vehicle exhaust, untreated smoke, and untreated water all contribute to the problem. Continued economic growth, urbanization, and an increase in the number of vehicles, together with lax enforcement of environmental laws, will result in further increases in pollution levels.
Concern with New Delhi's air quality got so bad that the Supreme Court recently stepped in and placed a limit on the number of new car registrations in the capital. The court order caps registrations at 1,500 per month, and all new cars must pass emission tests. New car registrations were running at more than 4,000 per month before the decision. The Indian Foundation of Transport Research and Training heralds this as a good first step, but it will need to be duplicated in India's other major cities in order to make an impact.
Greenhouse Gas Emissions
India emits the
fifth most carbon of any country in the world. At 253 million metric tons,
only the U.S., China, Russia, and Japan surpassed its level of carbon emissions
in 1998. Carbon emissions have grown nine-fold over the past forty years. Going
forward, carbon emissions are forecast to grow 3.2% per annum until 2020. To put
this in perspective, carbon emissions levels are estimated to increase by 3.9%
for China and by 1.3% for the United States. India is a non-Annex I country
under the United Nations Framework Convention on Climate Change, and as such, is
not required to reduce its carbon emissions. An historical summary of carbon
dioxide (CO2) emissions from fossil fuel use in India is shown in
Table 17.
| Component | 1990 | 1991 | 1992 | 1993 | 1994 | 1995 | 1996 | 1997 | 1998 | 1999 | 2000 |
| CO2 from coal | 101.29 | 105.26 | 116.63 | 123.15 | 125.34 | 155.90 | 152.83 | 153.18 | 151.96 | 154.77 | 166.24 |
| CO2 from natural gas | 9.35 | 10.55 | 10.56 | 10.18 | 10.93 | 11.85 | 12.87 | 13.22 | 13.94 | 13.79 | 14.49 |
| CO2 from petroleum | 45.02 | 45.70 | 48.78 | 52.40 | 53.72 | 58.51 | 61.79 | 65.04 | 69.52 | 71.43 | 72.55 |
| Total CO2 from all fossil fuels |
155.66 | 161.50 | 175.97 | 185.73 | 189.98 | 226.26 | 227.50 | 231.44 | 235.42 | 239.99 | 253.28 |
The need for foreign investment is putting pressure on India to open up its economy. The Indian government realizes it does not have the resources necessary to fund the huge capital requirements needed to meet its energy infrastructure demands. Much of the capital will have to come from foreign sources. Steps such as NELP and the elimination of oil price controls by 2003 are steps in the right direction, but more is needed to limit government control.
Restrictions on foreign participation were eased in July 1998 to encourage outside investment in electricity generation. Foreign energy companies can now take one-hundred percent ownership interest in enterprises valued up to $350 million. Prior levels were set at 74% ownership. Large-scale thermal projects with a capacity in excess of 1,500 MWe or hydroelectric plants with capacities of at least 500 MWe qualify for exemption from customs and countervailing duties. Ventures in generation or distribution using hydroelectric, coal, lignite, oil, or gas generating plants no longer need consent of the government. Investments in nuclear and distribution networks still need to pass a government screen.
Current limits on ownership of refinery operations for foreign companies are 49%. Hydrocarbon Vision 2025 recommends these limits be removed to allow 100% foreign ownership of Indian refineries. It has been suggested that the oil industry be privatized by 2005. Several foreign energy companies such as TotalFinaElf, Royal Dutch/Shell, and ExxonMobil are eying stakes in India’s state-run enterprises. Hydrocarbon Vision 2025 calls for the government to permit mergers involving independent refineries and large firms marketing petroleum ahead of oil liberalization in 2002. The downside to Hydrocarbon Vision 2025 is that state-run companies likely will retain the right to market transportation fuels.
Regulations have been reduced in the coal sector to try to entice foreign investment. Price controls on coal were eliminated on April 1, 2000 with the enactment of the Colliery Control Order of 2000 on April 1, 2000. A reform measure is pending before the Indian Parliament that would allow foreign enterprises to take minority stakes in private Indian coal mining companies.
Foreign investors by and large have been disappointed with the pace of privatization efforts and regulatory reform. The matter is compounded by the fact that many foreign companies have had bad experiences with their Indian investments, which makes them hesitant to try again. Other factors that work against government efforts to enlist greater support from foreign investors include lack of a comprehensive energy policy, a tariff system too easily influenced by political forces, and powerful State Electricity Boards and the likelihood of a hundred percent hike in the dividend tax to 22%.
Investment has been hurt by U.S. sanctions in the wake of May 1998 nuclear tests and restrictions on Export-Import Bank loans. Some of the companies that have either withdrawn from Indian power projects or seen their projects progress more slowly than anticipated include Cogentrix Energy, Daewoo Power, ABB, and Electricité de France (EDF). All shelved plans to participate in the construction of power generating plants.
Reform measures since 1991 have helped to brighten India's economic picture. Sustained measures over the past decade have led to some openings in the Indian economy and more closely aligned it with the major economies of the world. Despite some reforms, however, India’s economy is still mostly closed. Foreign firms, disappointed from past dealings with India’s difficult bureaucracy and turned off by high taxes and tariffs, are cautious to enter the market. U.S.-India trade was just $12.7 billion in 1999. Direct U.S. investment was $3.2 billion in 1998, up from $2.1 billion in 1995, but the rate of increase was much lower than with other countries with the same level of openness. A case in point is South Korea, a country not known for having policies receptive to foreign companies, which saw two-way trade with the U.S. jump from $1.8 billion to $5.1 billion over the same period.
However, the future looks bright for India’s economy. Potential trouble spots are high budget deficits, poor infrastructure, and barriers to trade. The economy has benefited from trade liberalization, low inflation, increased levels of international trade and foreign investment, and an improvement in foreign reserves.
The economy is expected to grow 6.3% in 2001, helped by heightened production in the industrial sector. Industrial growth for 2001 is forecast around 8%. Industry has benefited from strong exports and lower intermediate inputs and steady commodities prices. A strong performance in the service sector, helped by solid overseas success of India’s information technology (IT) sector, has been another economic driver.
Negative factors that have affected the economic outlook have been high interest rates, political uncertainty, a large budget deficit, and weak global markets. The budget deficit is around 10% of GDP. Declining agricultural production has crimped demand in rural areas, and consumer spending has been weaker due to uncertainty in financial markets. Faster economic growth in 2001 will likely push up inflation to 7.6%.
India, along with China, Indonesia, Brazil, and Russia are predicted to play a big part in shaping the global economy over the next 25 years, according to the World Bank. One World Bank study has pegged India to become the world’s fourth largest economy, after China, the U.S., and Japan, by 2020 in terms of Purchasing Power Parity (PPP).
An historical summary of India's GDP Growth Rate and inflation is shown in Table 18.
| Component | 1995 | 1996 | 1997 | 1998 | 1999 | 2000 |
| Annual GDP Growth Rate* (percent) |
7.3 | 7.0 | 4.2 | 5.2 | 6.1 | 5.5 |
| End-of-Year Inflation (percent) |
10.3 | 8.9 | 6.5 | 14.0 | 13.0 | 9.0 |
| Exchange Rate ** (Rs per US$) |
35.2 | 35.9 | 39.3 | 42.5 | 43.5 | 46.7 |
Pollution control equipment, oil and gas machinery, and power distribution and transmission systems are the three most promising sectors to foreign firms in energy-related businesses. Firms in the pollution control field will benefit from several trends in their favor. The first of these trends is heightened awareness of the strain that development and population growth are placing on the environment. An increasing number of firms are adopting environment management systems (ISO 14001) and other voluntary initiatives. Stricter enforcement of existing laws will force greater investment in pollution control technologies.
The market for environmental solutions is estimated at $2.9 billion with a 15% growth rate. Water treatment and sanitation, industrial wastewater treatment and recycling, industrial air pollution, hazardous waste management, treatment and disposal, biomedical waste management, municipal solid waste management, pollution testing and monitoring equipment and services, and environmental consulting and engineering services are all have growth potential. Of these, the potential seems the strongest for hazardous waste management, treatment and disposal, and vehicular emissions control and monitoring technology products and services. Greater reliance on Build-Own-Transfer (BOT) and Build-Own-Operate (BOO) projects increases the variety of opportunities open to foreign investors.
The market for oil and gas machinery appears positive due to government efforts to increase exploration and development of the country’s hydrocarbon resources to combat a widening energy deficit that must be met through foreign imports. Greater domestic oil and gas production would lessen foreign dependence on imports and give India a more secure energy supply. U.S. exports to India account for 30% of the oil and gas machinery market. U.S. firms are in a good position vis-à-vis other foreign competitors as India uses American Petroleum Institute (API) standards, and executives of Indian oil and gas firms are regular attendees of oil and gas exhibitions in the United States. The need for oil and gas machinery including seismic survey equipment and instruments, offshore/onshore drilling and equipment, and offshore logistical support services and equipment provide potential opportunities for foreign investment.
There are good opportunities for companies in the power distribution and transmission systems sector in India. Spending in this sector is expected to climb to $5.5 billion in 2001 versus $4.6 billion in 1999. Imports from the U.S. have risen 25-30%. The industry is benefiting from economic development and government efforts to increase generating capacity.
| For more information, please contact our Country Overview Project Manager: |
Richard
Lynch U.S. Department of Energy Office of Fossil Energy 1000 Independence Avenue Washington, D.C. 20585 USA telephone: 1-202-586-7316 |
 |
Return to India
page |
| last updated
on December 3, 2002 | Comments On Our Web Site Are Appreciated! |