|

Library >> Renewable
Energy Resource Maps >> Global
Maps >> Ocean
GLOBAL Renewable Energy Resources
Ocean Energy
Wave Energy
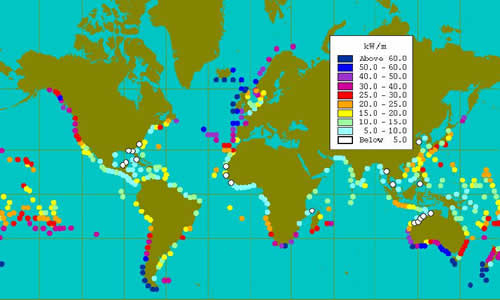
The wave power
density measured in kilowatts (kW) per meter (m)
of wave front for the various parts of the world
are provided in the following graphic
(Hagerman 2004).
This shows
that the most energy rich coastlines in the world
are located on the coasts of territories with a
western exposure to the Southern Ocean (Chile, South
Australia, south western coasts in South Island,
New Zealand as well as parts of Western Europe,
noteably Ireland, Scotland and Iceland as well as
western Canada and South Africa).
This does not necessarily mean that these areas
have the highest potential for wave energy exploitation
as there are many factors involved. Several of these
latter areas are isolated with poor communications.
The highest potential at the first stage for wave
energy is probably areas such as islands in the
trade wind belt of the Pacific, where overall wave
energy is much lower but considerably more steady
both in strength and direction. Such islands today
often rely on expensive imported diesel for power
generation.
http://www.oceanor.no/projects/wave_energy/
http://www.heco.com/CDA/default/0,1999,TCID%253D1%2526EmbedCID%253D0
%2526CCID%253D3453%2526LCID%253D3436%2526CTYP%253DARTC,00.html
Global Distribution of Deep Water
Wave Power Resources
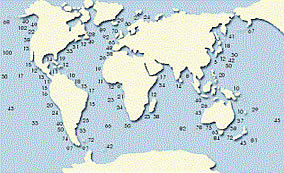
The maps above
show annual average wave power in kilowatts per
metre of crest lenght/ width for various sites around
the world.
The highest
energy waves are concentrated off the western coasts
in the 40o–60o latitude
range north and south. The power in the wave fronts
varies in these areas between 30 and 70 kW/m with
peaks to 100kW/m in the Atlantic SW of Ireland,
the Southern Ocean and off Cape Horn.
The capability
to supply electricity from this resource is such
that, if harnessed appropriately, 10% of the current
level of world supply could be provided. Work is
still needed to determine how much more may be captured
by other products (such as pumped water for desalination
or electrolysis), once the storage technology for
hydrogen is suitably developed.
http://www.worldenergy.org/wec-geis/publications/reports/ser/wave/wave.asp
http://www.oceanpd.com/Resource/default.html
Tidal Energy Patterns
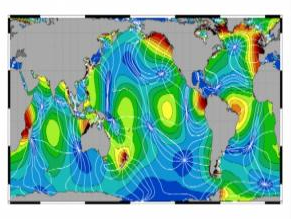
This map shows
the patterns of tidal energy played out across the
surface of the Earth as lines of force. The colors
indicate where tides are strongest, with blues being
weaker areas and reds being stronger. In almost
a dozen places on this map the lines appear to converge,
as if pulled together like a purse. Notice how at
each of these places the surrounding color--the
tidal force for that region--is blue. These convergent
areas are called amphidromes, places where there
is little or no apparent tide. This is not to say
that the surface of the ocean in these places doesn't
move, doesn't rise and fall with wind, momentum,
inertia, and other forces acting on it. But for
the purposes of studying the tides from space in
an effort to understand how energy is conserved
and distributed, these areas a mathematically still.
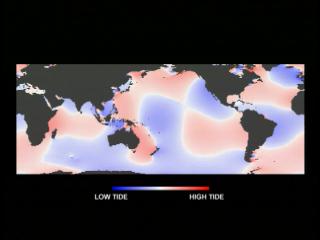
Blue signifies
places where the ocean level is lower than the average
reference height, and red shows areas where it's
higher. The difference is significant: between the
darkest blue and the brightest red is a range of
more than 49 feet (15 meters), displaced by lunar
tidal forces.
White areas
separating the blues and reds approximate the "zero"
point, a reference sea level against which other
areas are compared.
A few places on the map show areas where the tides
appear to revolve around a generally stable, unmoving
point. This is called an amphidrome, a place with
little or no tide at all.
http://svs.gsfc.nasa.gov/stories/topex/
Marine Current Energy
Map
of Surface Ocean Currents
Major ocean
currents of the world. On this illustration red
arrows indicate warm currents, while cold currents
are displayed in blue.
http://www.physicalgeography.net/fundamentals/8q_1.html
http://ocsenergy.anl.gov/documents/docs/
NREL
_Scoping_6_06_2006_web.pdf
Related GENI Resources
Links
Ocean
Energy Council (OEC)
WEC
Survey of Energy Resources
EERE
Ocean
NREL
Ocean Energy
|