| 
Library
>> Renewable Energy Resource Maps >>
North America >> Geothermal Geothermal
Energy in NORTH AMERICA
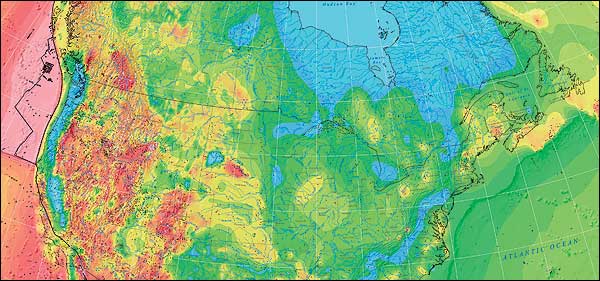 
The Geothermal Map
of North America is based on terrestrial heat flow as the primary determination
for the earth's crustal/lithospheric thermal conditions. Heat flow is the measure
of earth's transfer of energy and represents the expression of heat sources within
the earth. It is a key indicator of the potential availability of heat as a usable
resource.
This map illustrates heat transfer from lithospheric to local (individual
geothermal system) scales.
Three types of heat flow data points are included
on the map and used for contours that range from 15–150 milliwatts per square
meter. They are shown by different symbols because they may not be comparable
on a point-by-point basis, but the regional comparisons are useful.
Heat
flow data is from published heat flow values with strict criteria that limit the
numbers of such data. Bottom hole temperature (BHT) data is from Canadian, United
States, and Mexican oil and gas wells. Heat flow was estimated using BHT data
and thermal conductivities where they could be appropriately determined. Western
Geothermal Database data is heat flow from industry thermal gradient measurements
in areas expected to have high heat flow. In geothermal systems, the gradients
are often more than 75 degrees C per kilometer, and heat flow is more than 120
milliwatts per square meter. The basemap is from the U.S. Geological Survey's
The National Map for GTOPO30 (shaded relief; province, state, and country
boundaries; and rivers); ESRI sample data for place-names and city locations;
and General Bathymetric Chart of the Oceans (GEBCO) data. Other data included
is Holocene volcanoes and hot springs. View the U.S. map data. http://www.esri.com/mapmuseum/mapbook_gallery/volume20/mining2.html
CountriesCanada | Greenland
| United States of America
Related
GENI Resources Links
|