
Wind Energy: On the grid, Off the Checkerboard
Simulation in the "Journal of Renewable and Sustainable Energy" provides new insight into best arrangement of wind turbines on large installations
From the Journal: Journal of Renewable and Sustainable Energy
FOR IMMEDIATE RELEASE
Apr 1,2014 - Jason Bardi - aip.org
WASHINGTON D.C., April 1, 2014 -- As wind farms
grow in importance across the globe as sources
of clean,
renewable energy, one key consideration in their
construction is their physical design -- spacing
and orienting individual turbines to maximize
their efficiency and minimize any "wake
effects," where the swooping blades of one reduces the energy in the wind available for
the following turbine.
Optimally spacing
turbines allows them to capture more wind, produce
more power and increase revenue for the farm. Knowing
this, designers in the industry typically apply simple
computer models to help determine the best arrangements
of the turbines. This works well for small wind farms
but becomes less precise for larger wind-farms where
the wakes interact with one another and the overall
effect is harder to predict.
Now a team of researchers
at Johns Hopkins University (JHU) has developed a
new way to study wake effects that takes into account
the airflow both within and around a wind farm and
challenges the conventional belief that turbines
arrayed in checker board patterns produce the highest
power output. Their study provides insight into factors
that determine the most favorable positioning --
work described in a new paper in the Journal of Renewable
and Sustainable Energy, which is produced by AIP
Publishing.
This insight is important
for wind project designers in the future to configure
turbine farms for increased power output -- especially
in places with strong prevailing winds.
"It's important
to consider these configurations in test cases," said Richard Stevens, who conducted the research with Charles Meneveau and Dennice
Gayme at JHU. "If turbines are built in a non-optimal arrangement, the amount of electricity
produced would be less and so would the revenue of
the wind farm."
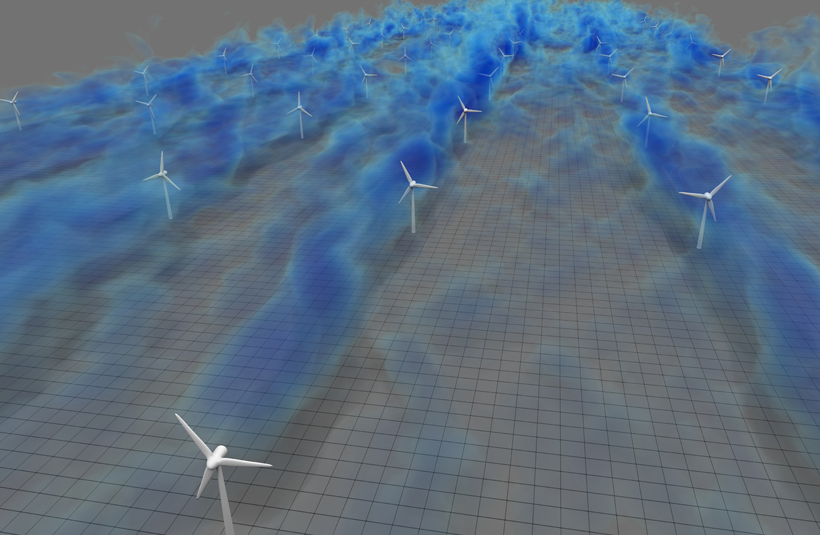
The figure shows a three-dimensional visualization of the flow in a simulated wind-farm. The blue regions show a volume rendering of low-velocity wind regions. These low velocity regions are primarily found in the meandering wakes behind the turbines.
CREDIT: Visualization made by David Bock (NCSA (National Center for Supercomputing Applications) and XSEDE (Extreme Science and Engineering Discovery Environment)) as part of the Extended Collaborative Support Services of XSEDE.
How Wind Farms are Currently Designed
Many considerations go into the design of a wind farm. The most ideal turbine
arrangement will differ depending on location. The
specific topology of the landscape, whether hilly
or flat, and the yearlong weather patterns at that
site both dictate the specific designs. Political
and social considerations may also factor in the
choice of sites.
Common test cases
to study wind-farm behavior are wind farms in which
turbines are either installed in rows, which will
be aligned against the prevailing winds, or in staggered,
checkerboard-style blocks where each row of turbines
is spaced to peek out between the gaps in the previous
row.
Staggered farms are
generally preferred because they harvest more energy
in a smaller footprint, but what Stevens and his
colleagues showed is that the checkerboard style
can be improved in some cases.
Specifically, they
found that better power output may be obtained through
an "intermediate" staggering, where each row is imperfectly offset -- like a checkerboard that
has slipped slightly out of whack.
This work was funded
by the National Science Foundation (grant #CBET 1133800
and #OISE 1243482) and by a “Fellowship for Young
Energy Scientists” awarded by the Foundation for
Fundamental Research on Matter in the Netherlands.
The work used XSEDE (NSF) and SURFsara (Netherlands)
computer resources.

|
 Map")